In general, printing from our four Analysis apps (Graphical Analysis, Spectral Analysis, Instrumental Analysis, and Video Analysis) is a two step process.
Printing Graphs and Data Tables
- Export the desired file (PNG graph image, or CSV data file).
- Click or tap the File menu,
 , then choose Export.
 - Choose the file type you want to export (e.g., Graph 1 or CSV)
- Specify where the file is to be saved, and save the file.
- Click or tap the File menu,
- Print the file using the printing tools on your device (computer, Chromebook, mobile device).
- Locate the saved file (e.g. in Google Drive or Downloads folder), then open the file.
- Choose Print and follow the print dialog steps.
- Older versions of iOS and Android™ apps do not have the Graph Image as an Export option. Use screen capture tools to capture an image of your graphs.
- Vernier Video Analysis does not have an export CSV option. Copy and paste data from the data table to a spreadsheet app and save that file.
- The exported graph images can be inserted into a document for reports.
- To capture images of an app as they appear on your device, use screen capture tools and print from the captured screen shot.
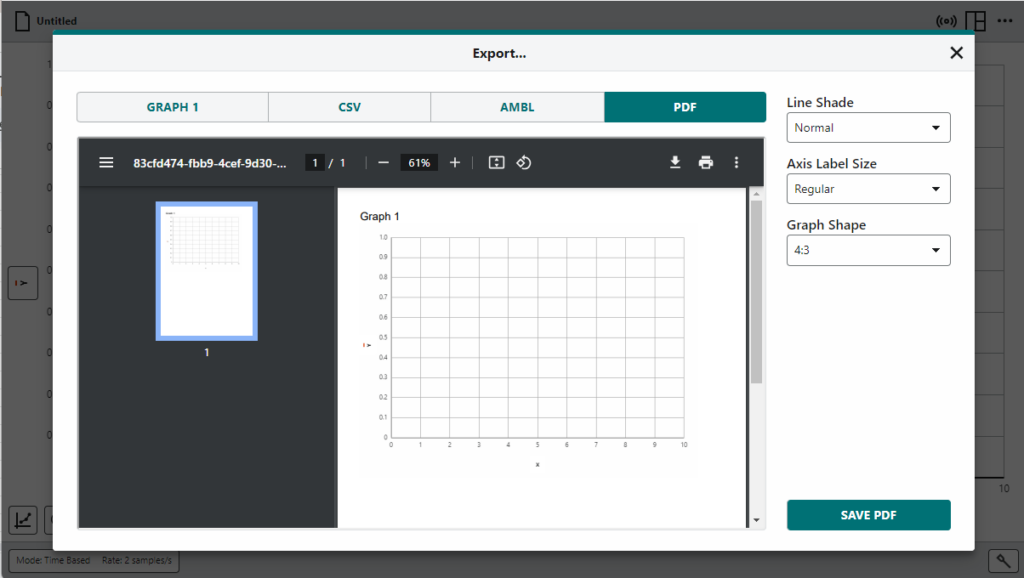
Printing a PDF – Graphical Analysis Pro only
Graphical Analysis Pro has an Export PDF option that includes all graphs in a single PDF file. You can use the PDF viewer tools in the Export dialog to print from this view without saving the file first.
- Printers must already be set up for your device.
- Feature is not available in the free version of Graphical Analysis, Spectral Analysis, Instrumental Analysis, or Video Analysis.
Related Articles
How do I save and use a graph or .csv data file from Graphical Analysis app on a Chromebook?
How do I save data as a csv file in Graphical Analysis app on iOS/iPadOS?