If you are running a remote data logging experiment with multiple Go Direct devices, and you want all of the sensor data in one Graphical Analysis file, you can simply retrieve the data from each device, one at a time. Similarly, if you have a single Go Direct device that performs multiple remote data logging experiments, you can retrieve each run into one Graphical Analysis file.
- Configure the Go Direct device for remote data logging.
For detailed instructions for configuring and starting a remote data logging experiment, refer to the document, Remote Data Logging: Trial Run - Run your remote data logging experiment.
- Launch Graphical Analysis and connect your sensor via USB or Bluetooth.
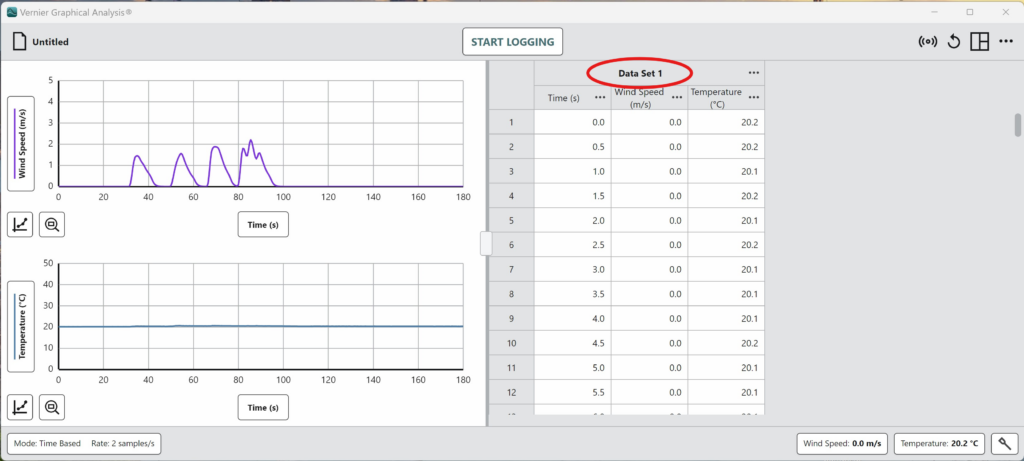
- Click Retrieve and Clear to download the data.
- Note the data set name of the first sensor is “Data Set 1”.
- Disconnect the sensor.
- Connect the next Go Direct sensor with remote data via USB or Bluetooth
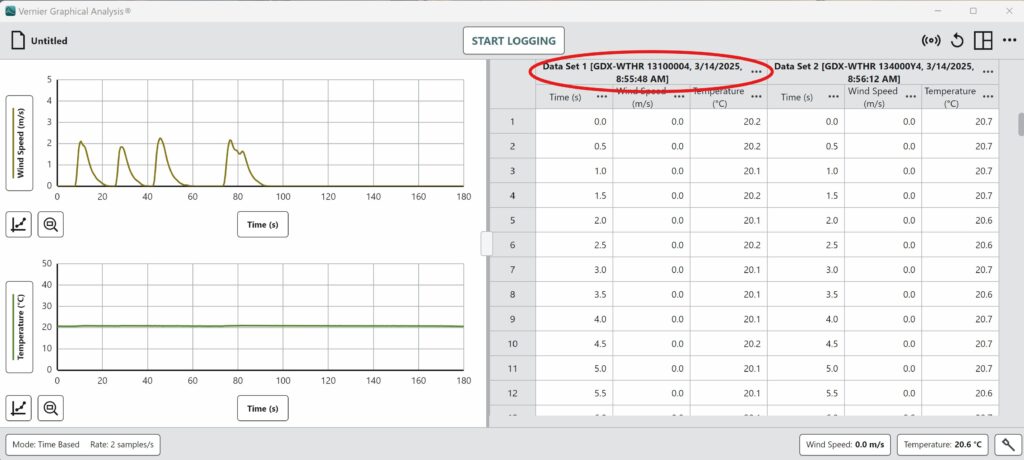
- Click Retrieve and Clear to download the data.
- Note that if the second Go Direct sensor is different than the first, the Data Set 1 name will update to include the Go Direct order code and serial number, as well as the date and time when the remote logging experiment was initiated. This helps to keep track of which data goes with which Go Direct device.
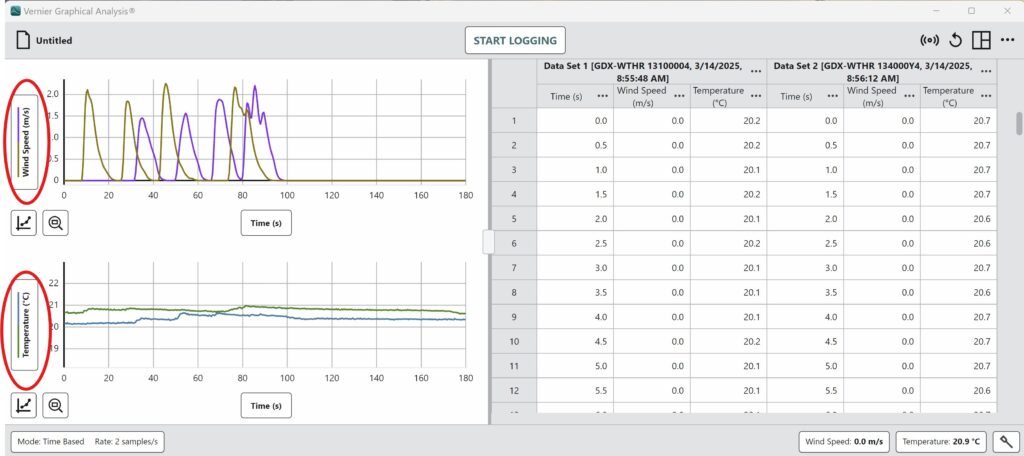
- Only the plot of the most current sensor will show on the graph. Click the y-axis label to add plots to the graph.
This feature, as well as the ability to perform remote data logging, is only available in Graphical Analysis 6.1 or newer.