Graphical Analysis is available both as an installed application and as a Progressive Web App (PWA) on some platforms. (This is also true for our apps Spectral Analysis and Instrumental Analysis apps.)
The sensor connection process to a PWA includes an additional step compared to the installed application because you must give the browser permission to connect to the sensor before the app running in the browser can connect to it. The steps here describe that process for wireless Bluetooth connection of a Go Direct sensor to the PWA version of Graphical Analysis. (See also instructions for connecting sensors via USB.)
- Open a new Chrome (or Edge) browser window and enter the URL for the Progressive Web App (PWA) version of Graphical Analysis— https://graphicalanalysis.app.
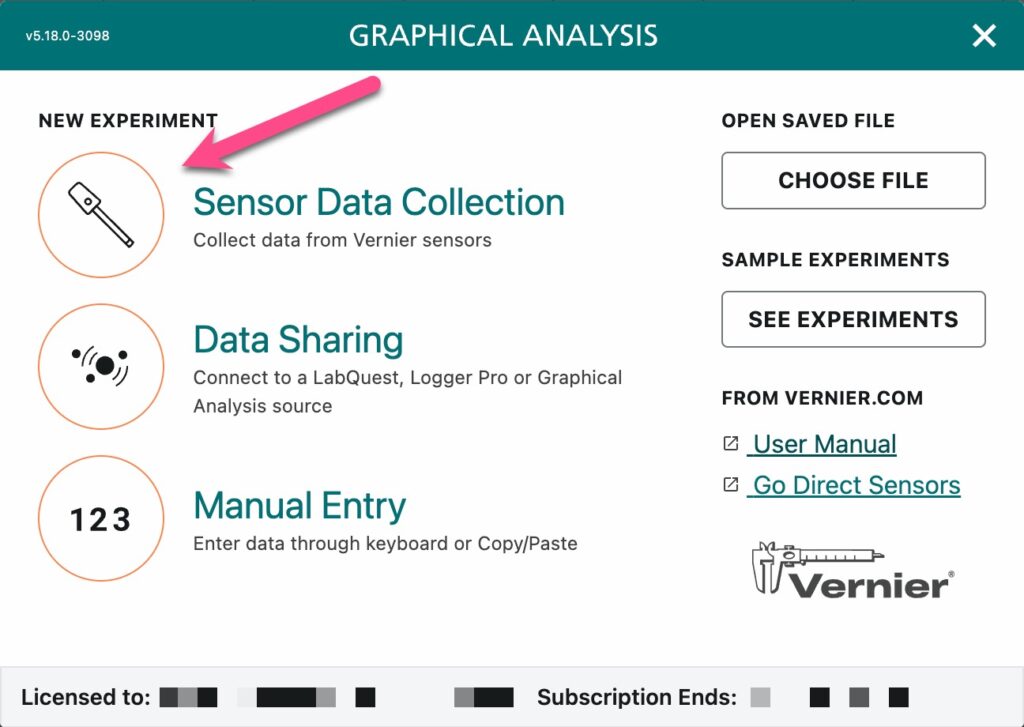
- From the New Experiment dialog box, click or tap Sensor Data Collection.
- For Spectral Analysis, click or tap Connect a Spectrometer.
- For Instrumental Analysis, click or tap Connect an Instrument.
- To access the new experiment box, click or tap File Menu,
 , and select New Experiment.

- Turn on your sensor and verify that the Bluetooth LED on the sensor is flashing red.
- If the LED is flashing green then it is already connected to another device. To disconnect the sensor from that device, press and hold the power button on the sensor until the sensor powers off, then turn the sensor on again.
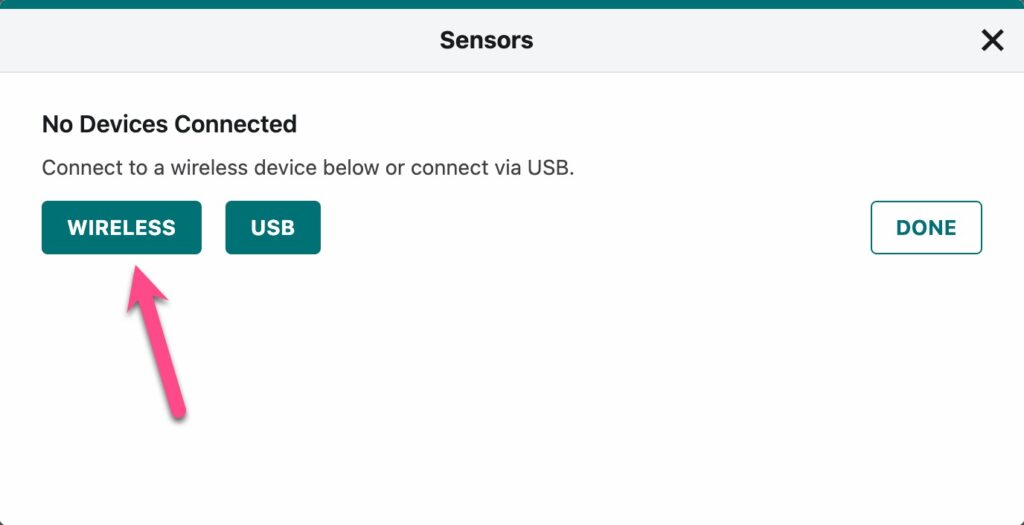
- From the Sensor Setup dialog box, click or tap Wireless,
 .
.

- From the “app wants to pair” dialog box, select the sensor you want to use, then click or tap Pair,
 .
.
- If a sensor does not appear in the box, make sure the sensor is on and its Bluetooth LED is flashing red.
- If no sensors appear in the box, make sure your browser permissions allow Bluetooth.

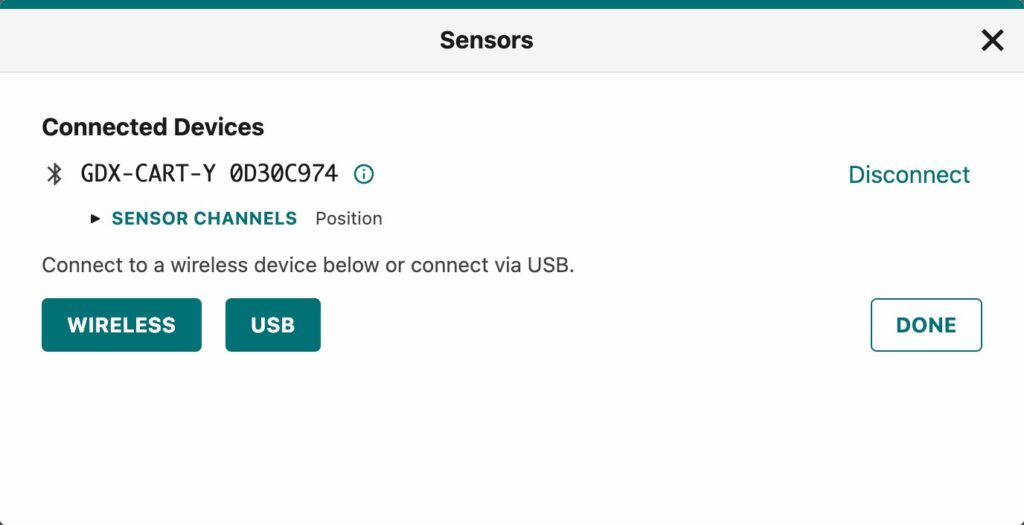
- Once your sensor is paired, you can make adjustments to the Sensor Channels for that sensor, if needed. This is not applicable to all sensors.
- Repeat Steps 4 – 6 to connect additional sensors, if needed.

- Click or tap Done,
 , to proceed to data collection.
