Barometer User Manual
Order Code: BAR-BTA
Barometer
(Order Code BAR-BTA)
The Barometer measures atmospheric pressure. As shipped, it measures actual, or station pressure, but it can be calibrated to measure the elevation-adjusted, or sea level pressure, if desired for weather studies.
Note: Vernier products are designed for educational use. Our products are not designed nor are they recommended for any industrial, medical, or commercial process such as life support, patient diagnosis, control of a manufacturing process, or industrial testing of any kind.
Compatible Interfaces and Software
Choose a platform below to see its compatibility requirements.LabQuest
Interface LabQuest App LabQuest 3 Full support LabQuest 2 Full support LabQuest Full support Computers
Software Interface Graphical Analysis Graphical Analysis (Web App) Logger Pro (discontinued) Logger Lite (discontinued) LabQuest Mini Full support Full support Full support Full support LabQuest 3 Full support Full support Full support Incompatible LabQuest 2 Full support Full support Full support Full support LabQuest Stream Full support 1 Full support 1 Partial support 2 Full support 1 Go!Link Full support Full support Full support Full support LabQuest Full support Full support Full support Full support LabPro Incompatible Incompatible Full support Full support Compatibility Notes
Chromebook
Software Interface Graphical Analysis (Web App) LabQuest Mini Full support LabQuest 3 Full support LabQuest 2 Full support LabQuest Stream Full support 1 Go!Link Full support LabQuest Full support Compatibility Notes
iOS
Software Interface Graphical Analysis Graphical Analysis GW LabQuest Stream Full support Full support LabQuest 3 Full support 1 Full support 1 LabQuest 2 Full support 1 Full support 1 Compatibility Notes
Android
Software Interface Graphical Analysis Graphical Analysis GW LabQuest Stream Full support Full support LabQuest 3 Full support 1 Full support 1 LabQuest 2 Full support 1 Full support 1 Compatibility Notes
Arduino
Software Interface Arduino Vernier Arduino® Interface Shield Full support LabVIEW
Software Interface NI LabVIEW SensorDAQ Full support Vernier myDAQ Adapter Full support 1 Go!Link Full support LabQuest Mini Full support LabQuest Stream Full support LabQuest 3 Full support LabQuest 2 Full support LabQuest Full support Compatibility Notes
Texas Instruments
Software Interface EasyData DataMate TI-84 SmartView DataQuest TI-Nspire Software EasyLink Full support 1 Incompatible Full support 2 Full support Full support 2 CBL 2 Full support 3 Full support 3 4 Incompatible Incompatible Incompatible LabPro Full support 3 Full support 3 4 Incompatible Incompatible Incompatible TI-Nspire Lab Cradle Incompatible Incompatible Incompatible Full support Full support Compatibility Notes
Quick Start
- Plug the sensor into the interface (LabQuest 3, LabQuest Mini, etc.).
- Connect the interface to your device.
- If using USB, connect to the USB port on your computer.
- If using Bluetooth® wireless technology, click your interface type and then select your device.
- Prepare for data collection:
- Vernier Graphical Analysis®: Launch the app, if necessary, and click Sensor Data Collection.
- LabQuest® App: Choose New from the File menu.
The software will identify the sensor and load a default data-collection setup. You are now ready to collect data.
Need Additional Information?
Visit the following link:
Using the Barometer for Weather Studies
As discussed above, the Barometer has been calibrated to read station pressure. If you prefer it to read sea level pressure for conducting weather studies, you can perform a one-point calibration to correct for elevation. You may also want to change units to something more appropriate for weather studies such as in Hg or mbar. To do this, connect the Barometer to an interface and launch the software. Change the units first, if desired. Initiate the calibration procedure and choose the one-point calibration option. Enter the sea-level corrected pressure value for your location obtained from a reputable source (NOAA, Weather Underground, etc.). Save this calibration onto the sensor (this option is found on the Storage tab in LabQuest App and the Calibration Storage tab in Logger Pro).
Specifications
|
Pressure range (as shipped) |
77.98 kPa to 105.29 kPa |
|
Maximum pressure that the sensor can |
310 kPa |
|
Resolution |
0.00830 kPa |
|
Combined linearity and hysteresis |
±0.5% Full Scale |
|
Response time |
100 microseconds |
|
Temperature range |
–25°C to 85°C |
|
Calibration values |
slope: 6.825 kPa/V intercept: 76.29375 kPa |
How the Barometer Works
The heart of this circuit is a pressure sensor. It has a membrane that flexes as pressure changes. This sensor is set up for absolute pressure measurement, so one side of the membrane is a vacuum. The sensor produces an output voltage that varies in a linear way with absolute pressure. It includes special circuitry to minimize errors caused by changes in temperature.
Station Pressure vs. Sea Level Pressure
Station pressure is the true atmospheric pressure at your location, or station. This is the pressure your Barometer is calibrated to read and is useful for tasks such as gas law calculations or as an altimeter. Sea level pressure is the pressure after the station pressure has been adjusted to its equivalent pressure at sea level. This is commonly done to normalize pressures at various altitudes for weather forecasts. If this was not done, there would always appear to be areas of low pressure over high-elevation cities such as Denver. If weather studies are of interest, the next section will explain how to recalibrate your Barometer.
Weather Studies
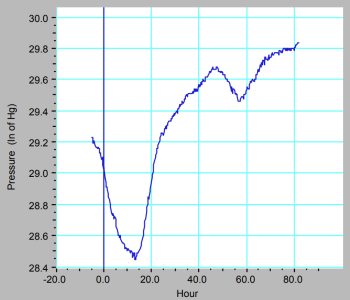
This sensor can be an accurate, reliable barometer as part of a weather station. It is temperature compensated, so changes in room temperature will not interfere with the data. It is especially interesting to watch pressure changes as a storm moves in. You could connect temperature, relative humidity, or light sensors to the same computer. We used a Barometer to produce the graph in Figure 1 during the biggest storm in a decade in Portland, Oregon (December 1995).

Altimeter
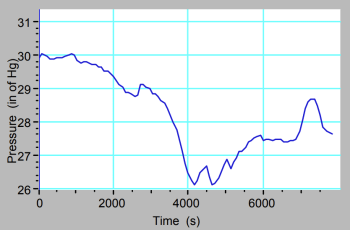
If you have a portable interface such as a LabQuest, you can do some interesting studies using this sensor as you drive in a mountainous area. Simply leave the Barometer in the car and take data as you drive. The pressure reading gives you a measure of the altitude. Figure 2 is a graph collected while driving over a pass in the Cascades mountain range.

Pressure in Liquids
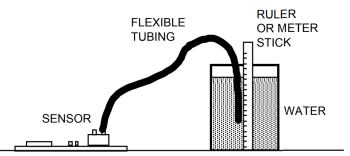
The pressure in a liquid can be investigated. Connect the tubing to the input port of the Barometer before you put the end of the tube under water. Collect pressure data as a function of depth. Model this data with a linear function.

Barometer Models
This user manual is valid for Barometers sold beginning in November 2014, Model BAR4314R2. For earlier models, see the legacy section at www.vernier.com/legacy-manuals
Troubleshooting
For troubleshooting and FAQs, see www.vernier.com/til/1404
Repair Information
If you have followed the troubleshooting steps and are still having trouble with your Barometer, contact Vernier Technical Support at support@vernier.com or call 888-837-6437. Support specialists will work with you to determine if the unit needs to be sent in for repair. At that time, a Return Merchandise Authorization (RMA) number will be issued and instructions will be communicated on how to return the unit for repair.
Warranty
Warranty information for this product can be found on the Support tab at www.vernier.com/bar-bta/#support
General warranty information can be found at www.vernier.com/warranty
Contact Support
Fill out our online support form or call us toll-free at 1-888-837-6437.

