Introduction
Pendulum motion has long fascinated people. Galileo studied pendulum motion by watching a swinging chandelier and timing it with his pulse. In 1851 Jean Foucault demonstrated that the earth rotates by using a long pendulum which swung in the same plane while the earth rotated beneath it.
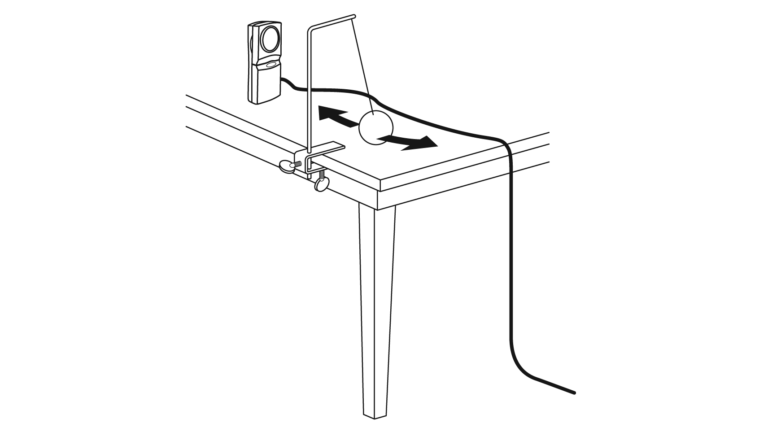
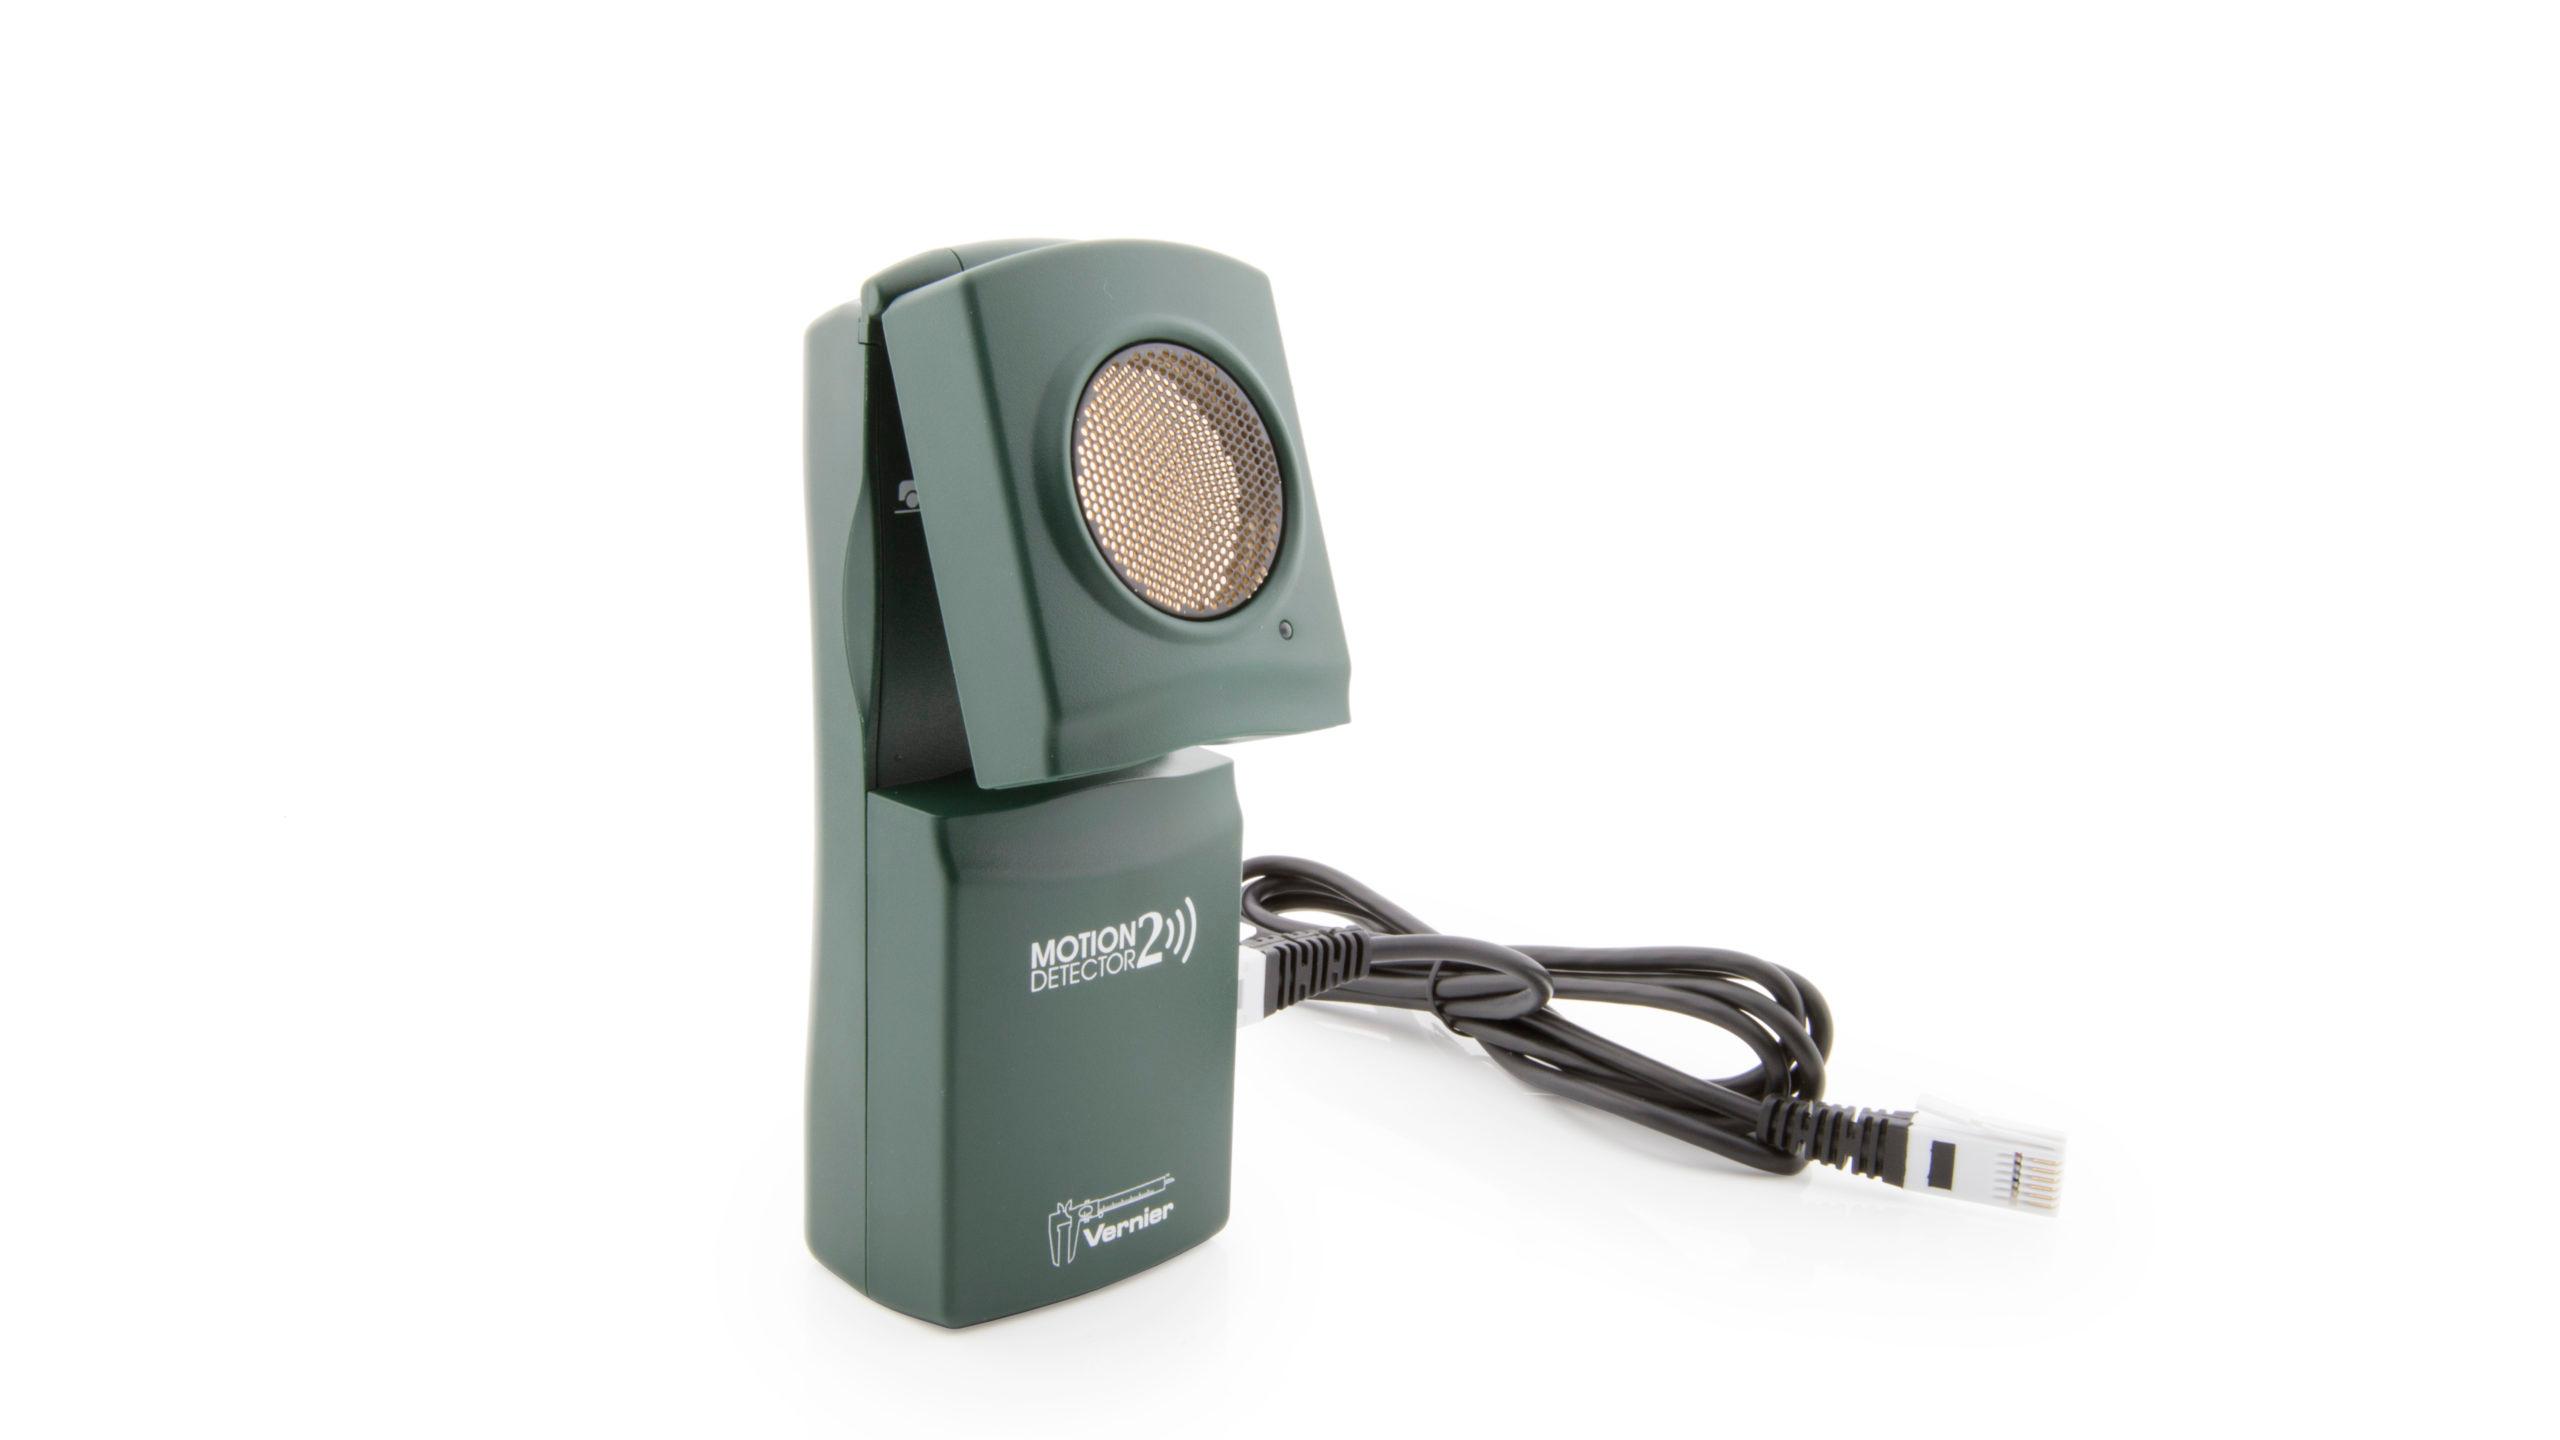
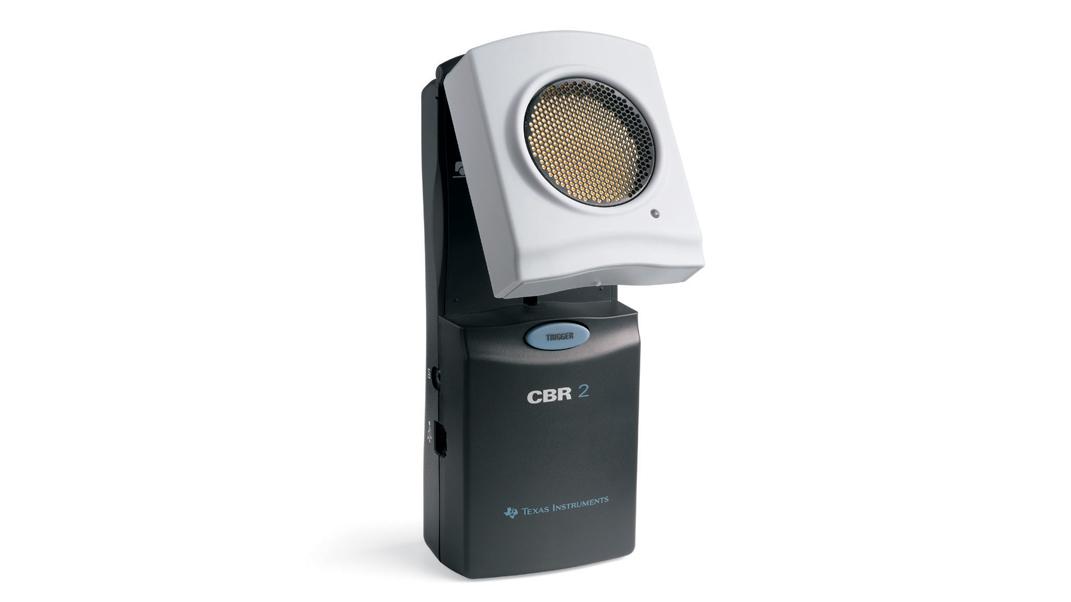
As long as the swing is not too wide, the pendulum approximates simple harmonic motion and produces a sinusoidal pattern. In this activity, you will use a Motion Detector to plot the position versus time graph for a simple pendulum. You will time the motion to calculate the period, and use a ruler to measure the maximum displacement. You will then use the data to model the motion with the cosine function to mimic the position versus time graph:
Objectives
- Record the horizontal position versus time for a swinging pendulum.
- Determine the period of the pendulum motion.
- Model the position data using a cosine function.
Sensors and Equipment
This experiment features the following sensors and equipment. Additional equipment may be required.
Ready to Experiment?
Ask an Expert
Get answers to your questions about how to teach this experiment with our support team.
- Call toll-free: 888-837-6437
- Chat with Us
- Email support@vernier.com
Purchase the Lab Book
This experiment is #22 of Real-World Math with Vernier. The experiment in the book includes student instructions as well as instructor information for set up, helpful hints, and sample graphs and data.


