Swinging Ellipses – Plotting an Ellipse
Experiment #20 from Real-World Math with Vernier
- Education Level
- High School

Introduction
Any ellipse centered at the origin can be expressed in the form
where ± a and ± b represent the x– and y-intercepts of the ellipse.
To graph an ellipse on a calculator, the expression above must first be solved for y to obtain
This equation is entered into the calculator in two parts, one expression for the positive part (upper half of the ellipse) and one for the negative part (lower half of the ellipse).
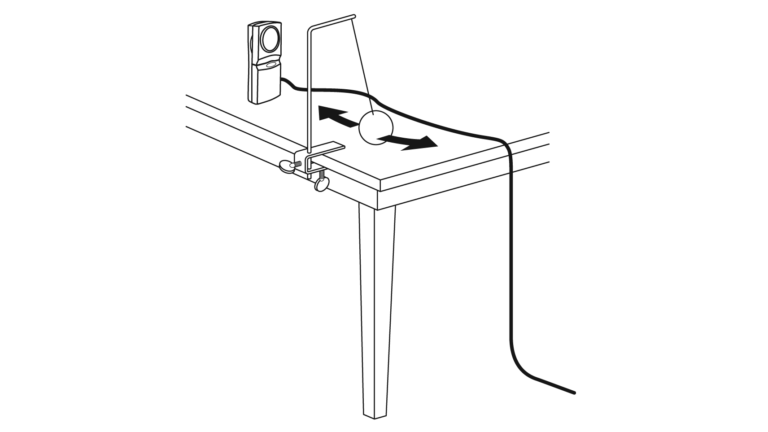
In this activity you will use the Motion Detector to record the position and velocity of a swinging pendulum. You will find that the plot of velocity versus position is elliptical, and that you can model it with the standard equation of an ellipse.
Objectives
- Record position and velocity versus time data for a swinging pendulum.
- Plot data as a velocity versus position phase plot.
- Determine an ellipse that fits the phase plot.
Sensors and Equipment
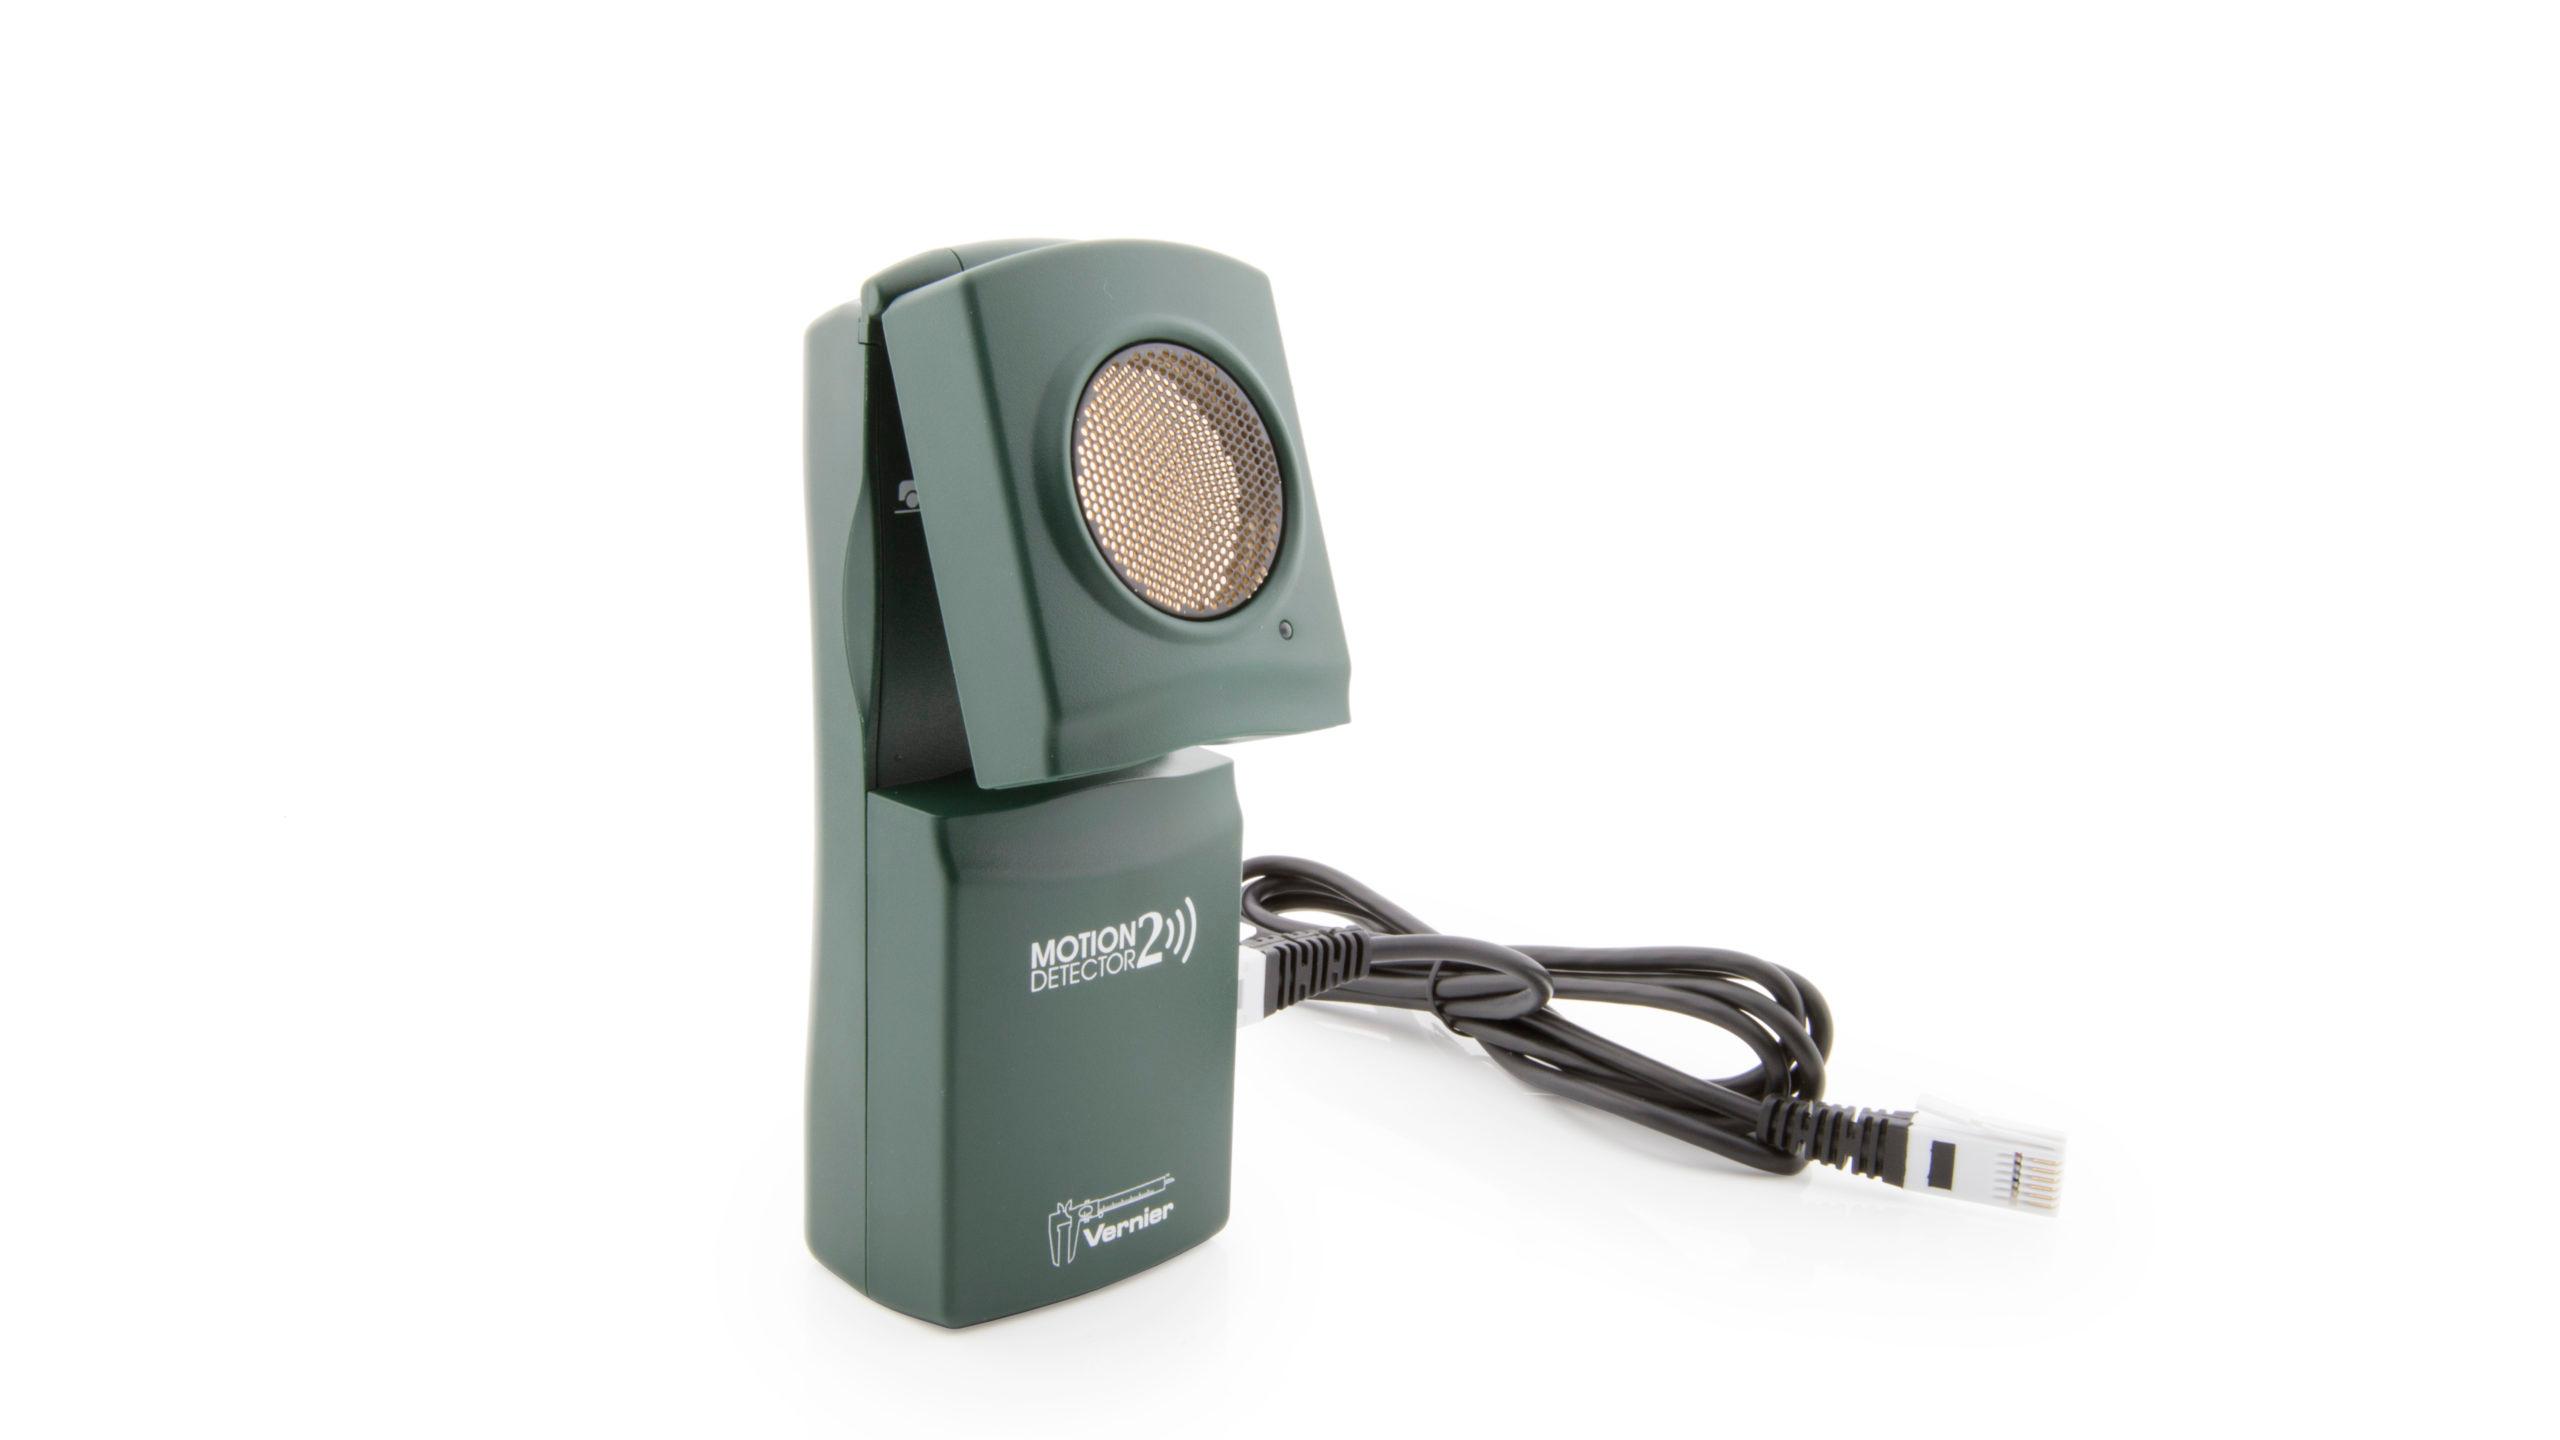
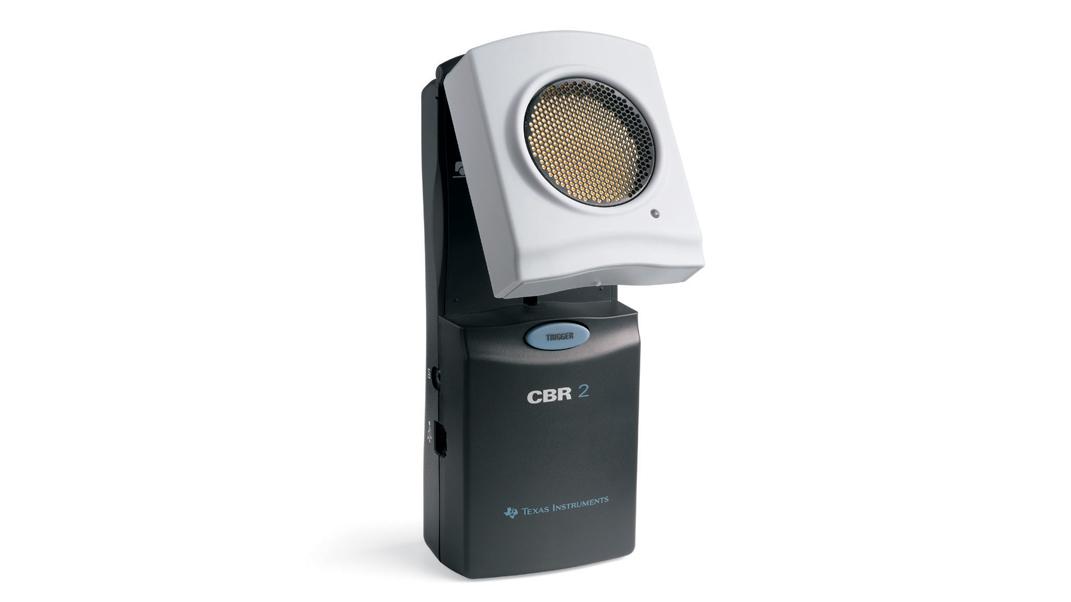
This experiment features the following sensors and equipment. Additional equipment may be required.
Option 1

Option 2

Ready to Experiment?
Ask an Expert
Get answers to your questions about how to teach this experiment with our support team.
- Call toll-free: 888-837-6437
- Chat with Us
- Email support@vernier.com
Purchase the Lab Book
This experiment is #20 of Real-World Math with Vernier. The experiment in the book includes student instructions as well as instructor information for set up, helpful hints, and sample graphs and data.

