Bounce Back – The Pattern of Rebound Heights
Experiment #18 from Real-World Math with Vernier
- Education Level
- High School

Introduction
When a ball bounces up and down on a flat surface, the maximum height it reaches decreases from bounce to bounce. In fact, the maximum height decreases in a very predictable way for most types of balls. The relationship between the maximum height attained by the ball on a given bounce (which we will call the rebound height) and number of bounces that have occurred since the ball was released is an exponential
where y represents the rebound height, x represents the bounce number, h is the release height, and p is a constant that depends on the physical characteristics of the ball used. It’s easy to see where this model comes from: Suppose that the ball is released from height h. Then on each bounce it rebounds to a fraction p of the previous maximum height. After zero, one and two bounces, the ball will attain a maximum height of h, hp, (hp)p = hp2, and so forth. The relation above is generalized for any x number of bounces.
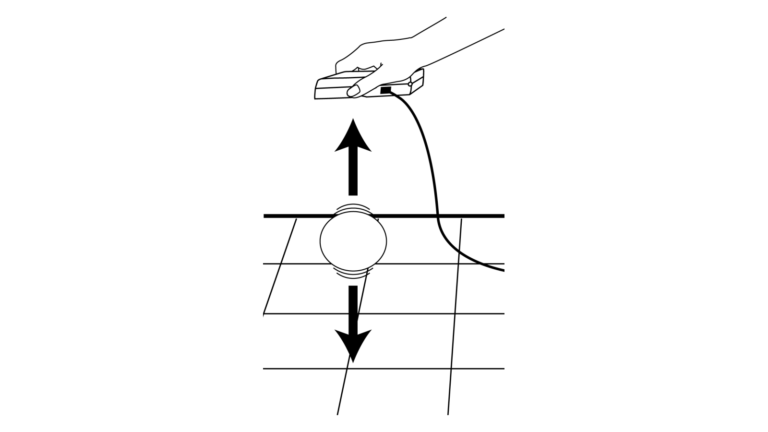
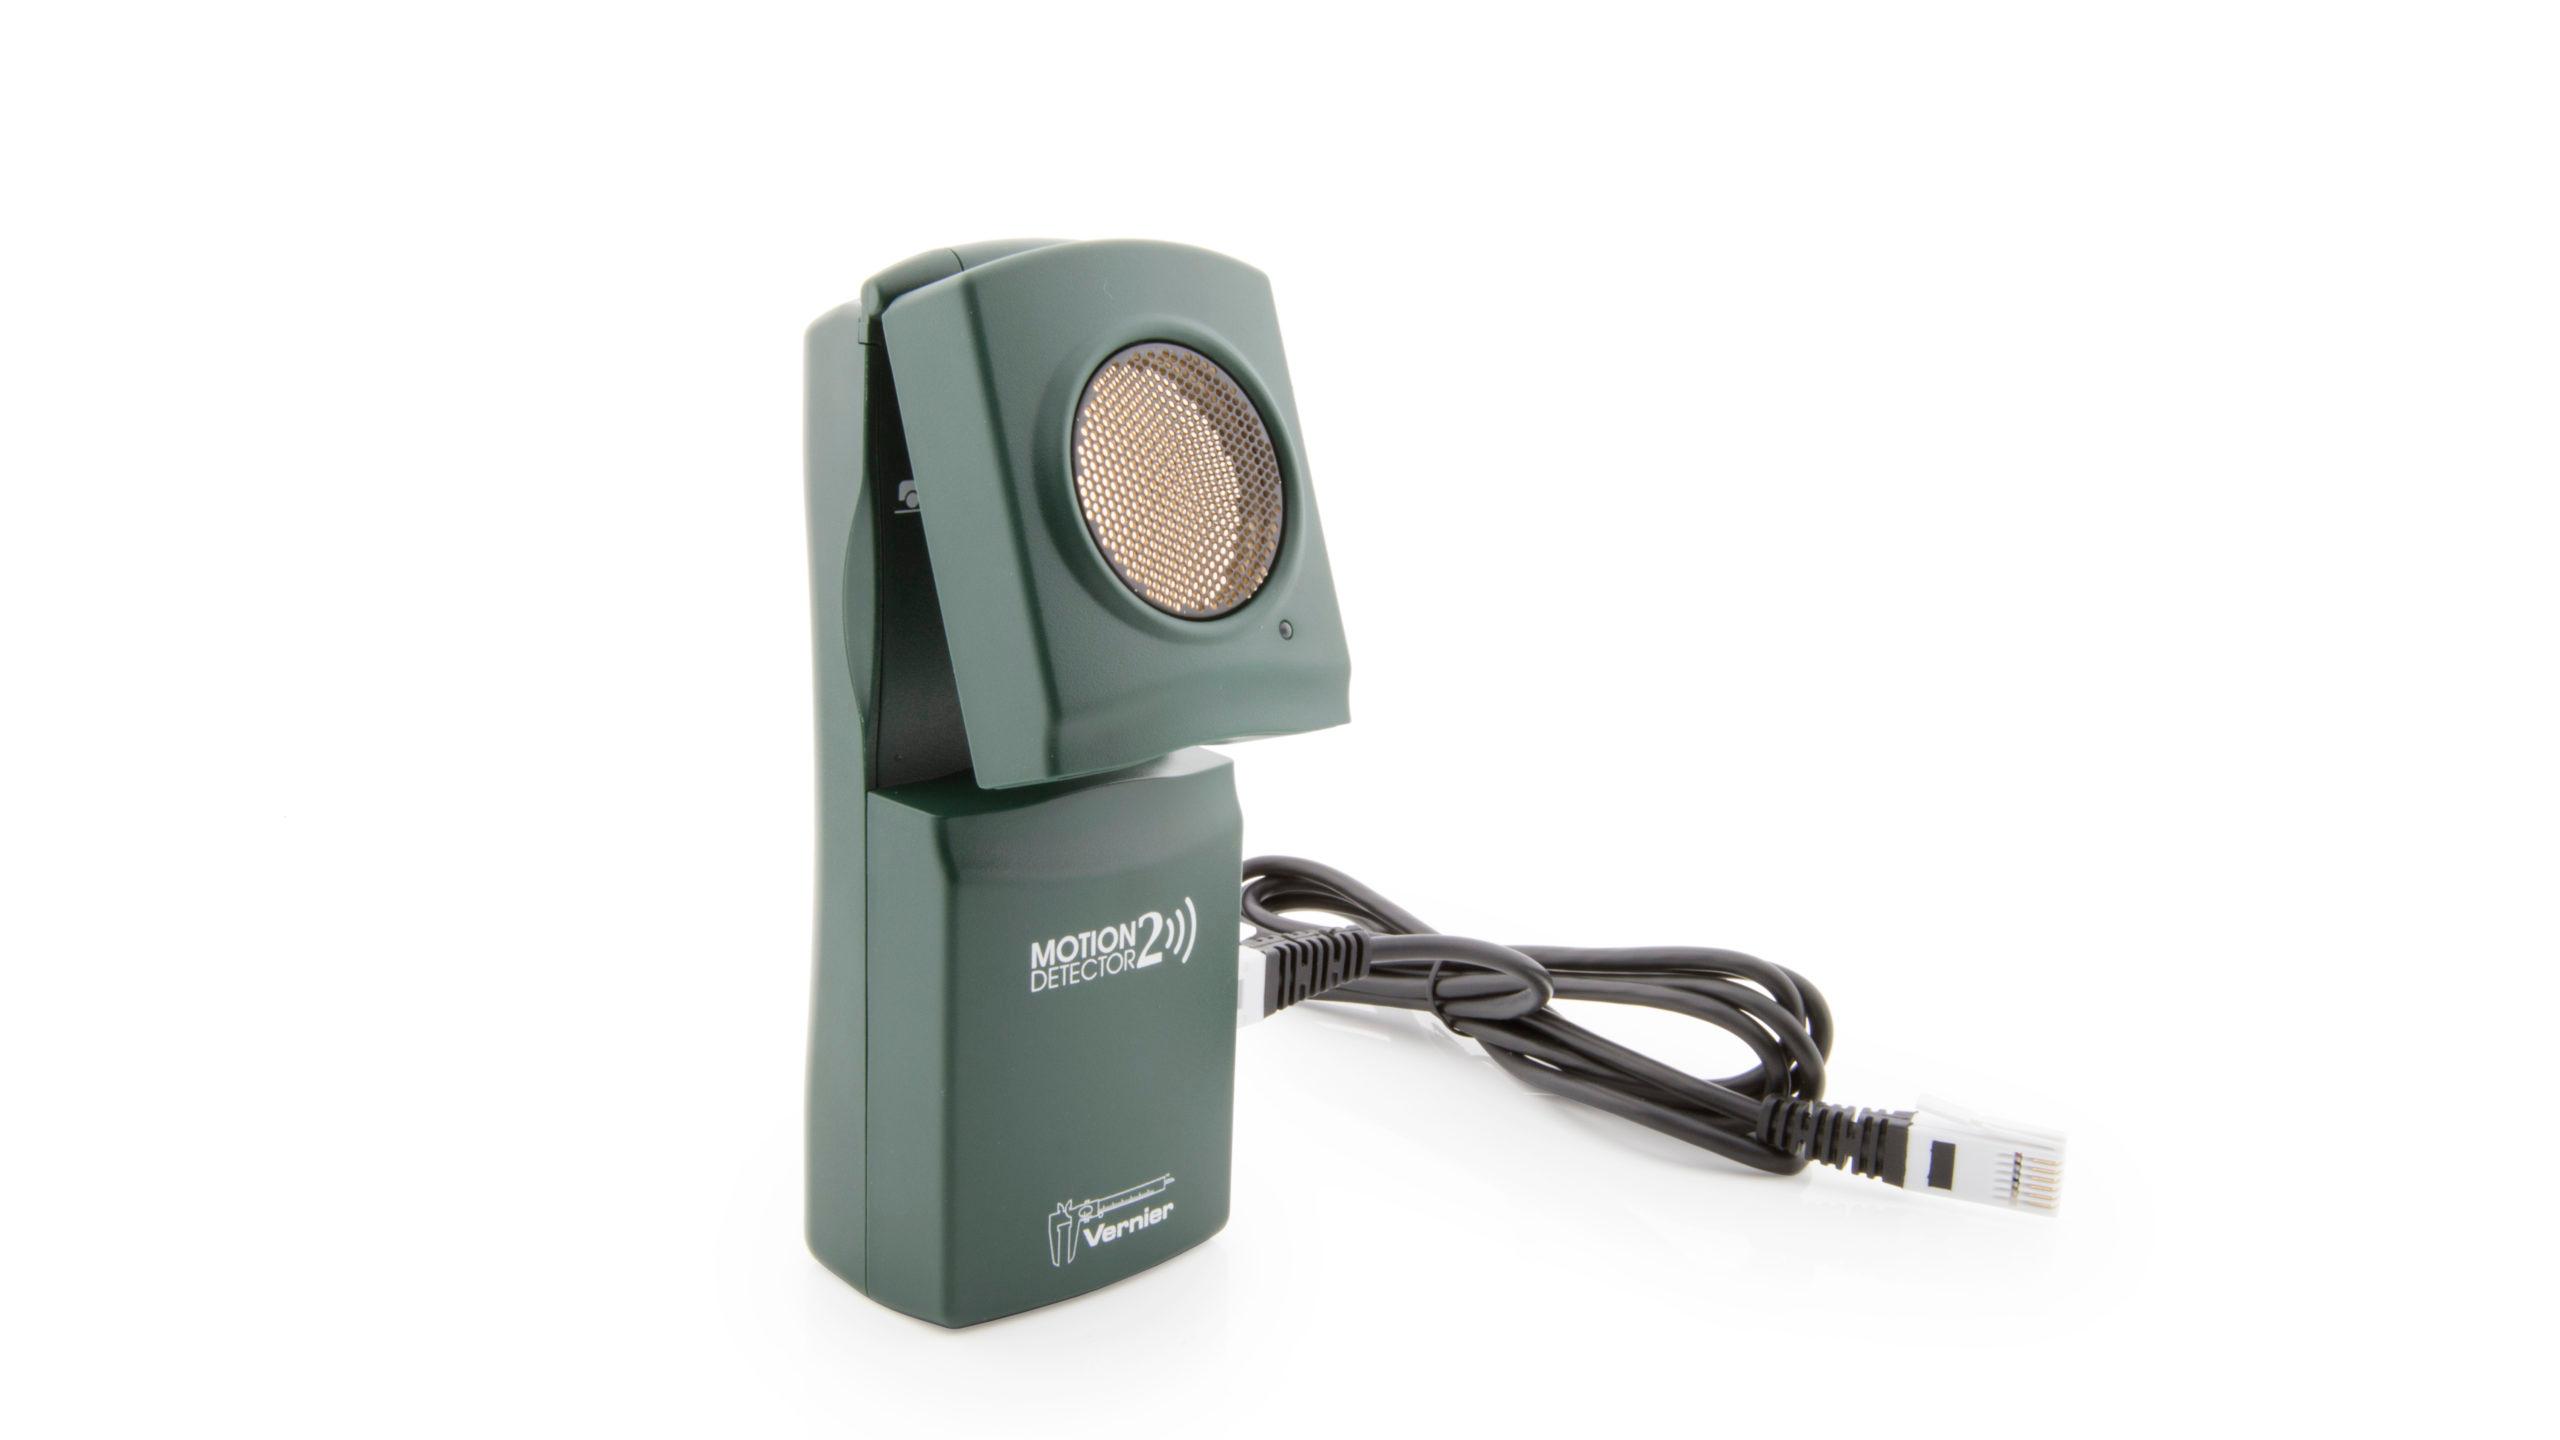
In this exercise, you will collect motion data for a bouncing ball using a Motion Detector. You will then analyze this data to test the model y = hpx.
Objectives
- Record the successive maximum heights for a bouncing ball.
- Model the bounce height data with an exponential function.
Sensors and Equipment
This experiment features the following sensors and equipment. Additional equipment may be required.
Option 1

Option 2

Ready to Experiment?
Ask an Expert
Get answers to your questions about how to teach this experiment with our support team.
- Call toll-free: 888-837-6437
- Chat with Us
- Email support@vernier.com
Purchase the Lab Book
This experiment is #18 of Real-World Math with Vernier. The experiment in the book includes student instructions as well as instructor information for set up, helpful hints, and sample graphs and data.

