Introduction
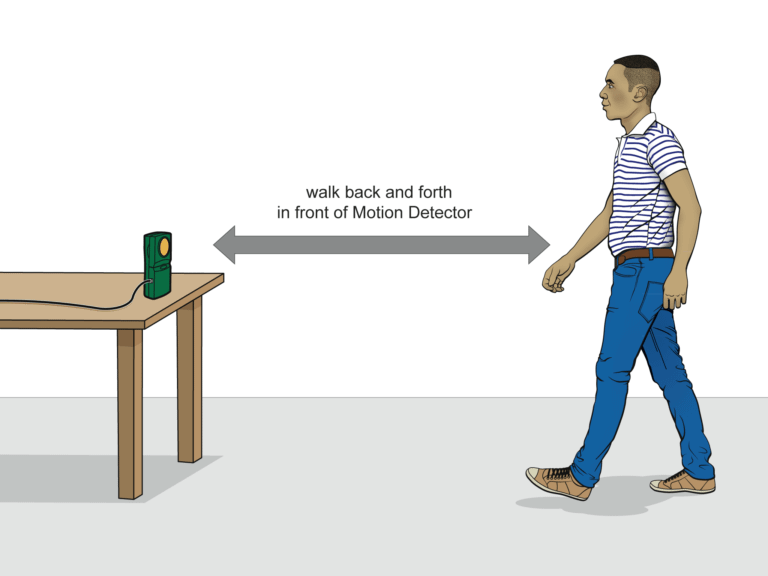
One of the most effective methods of describing motion is to plot graphs of position, velocity, and acceleration vs. time. From such a graphical representation, it is possible to determine in what direction an object is going, how fast it is moving, how far it traveled, and whether it is speeding up or slowing down. In this experiment, you will use a Motion Detector to determine this information by plotting a real-time graph of your motion as you move across the classroom.
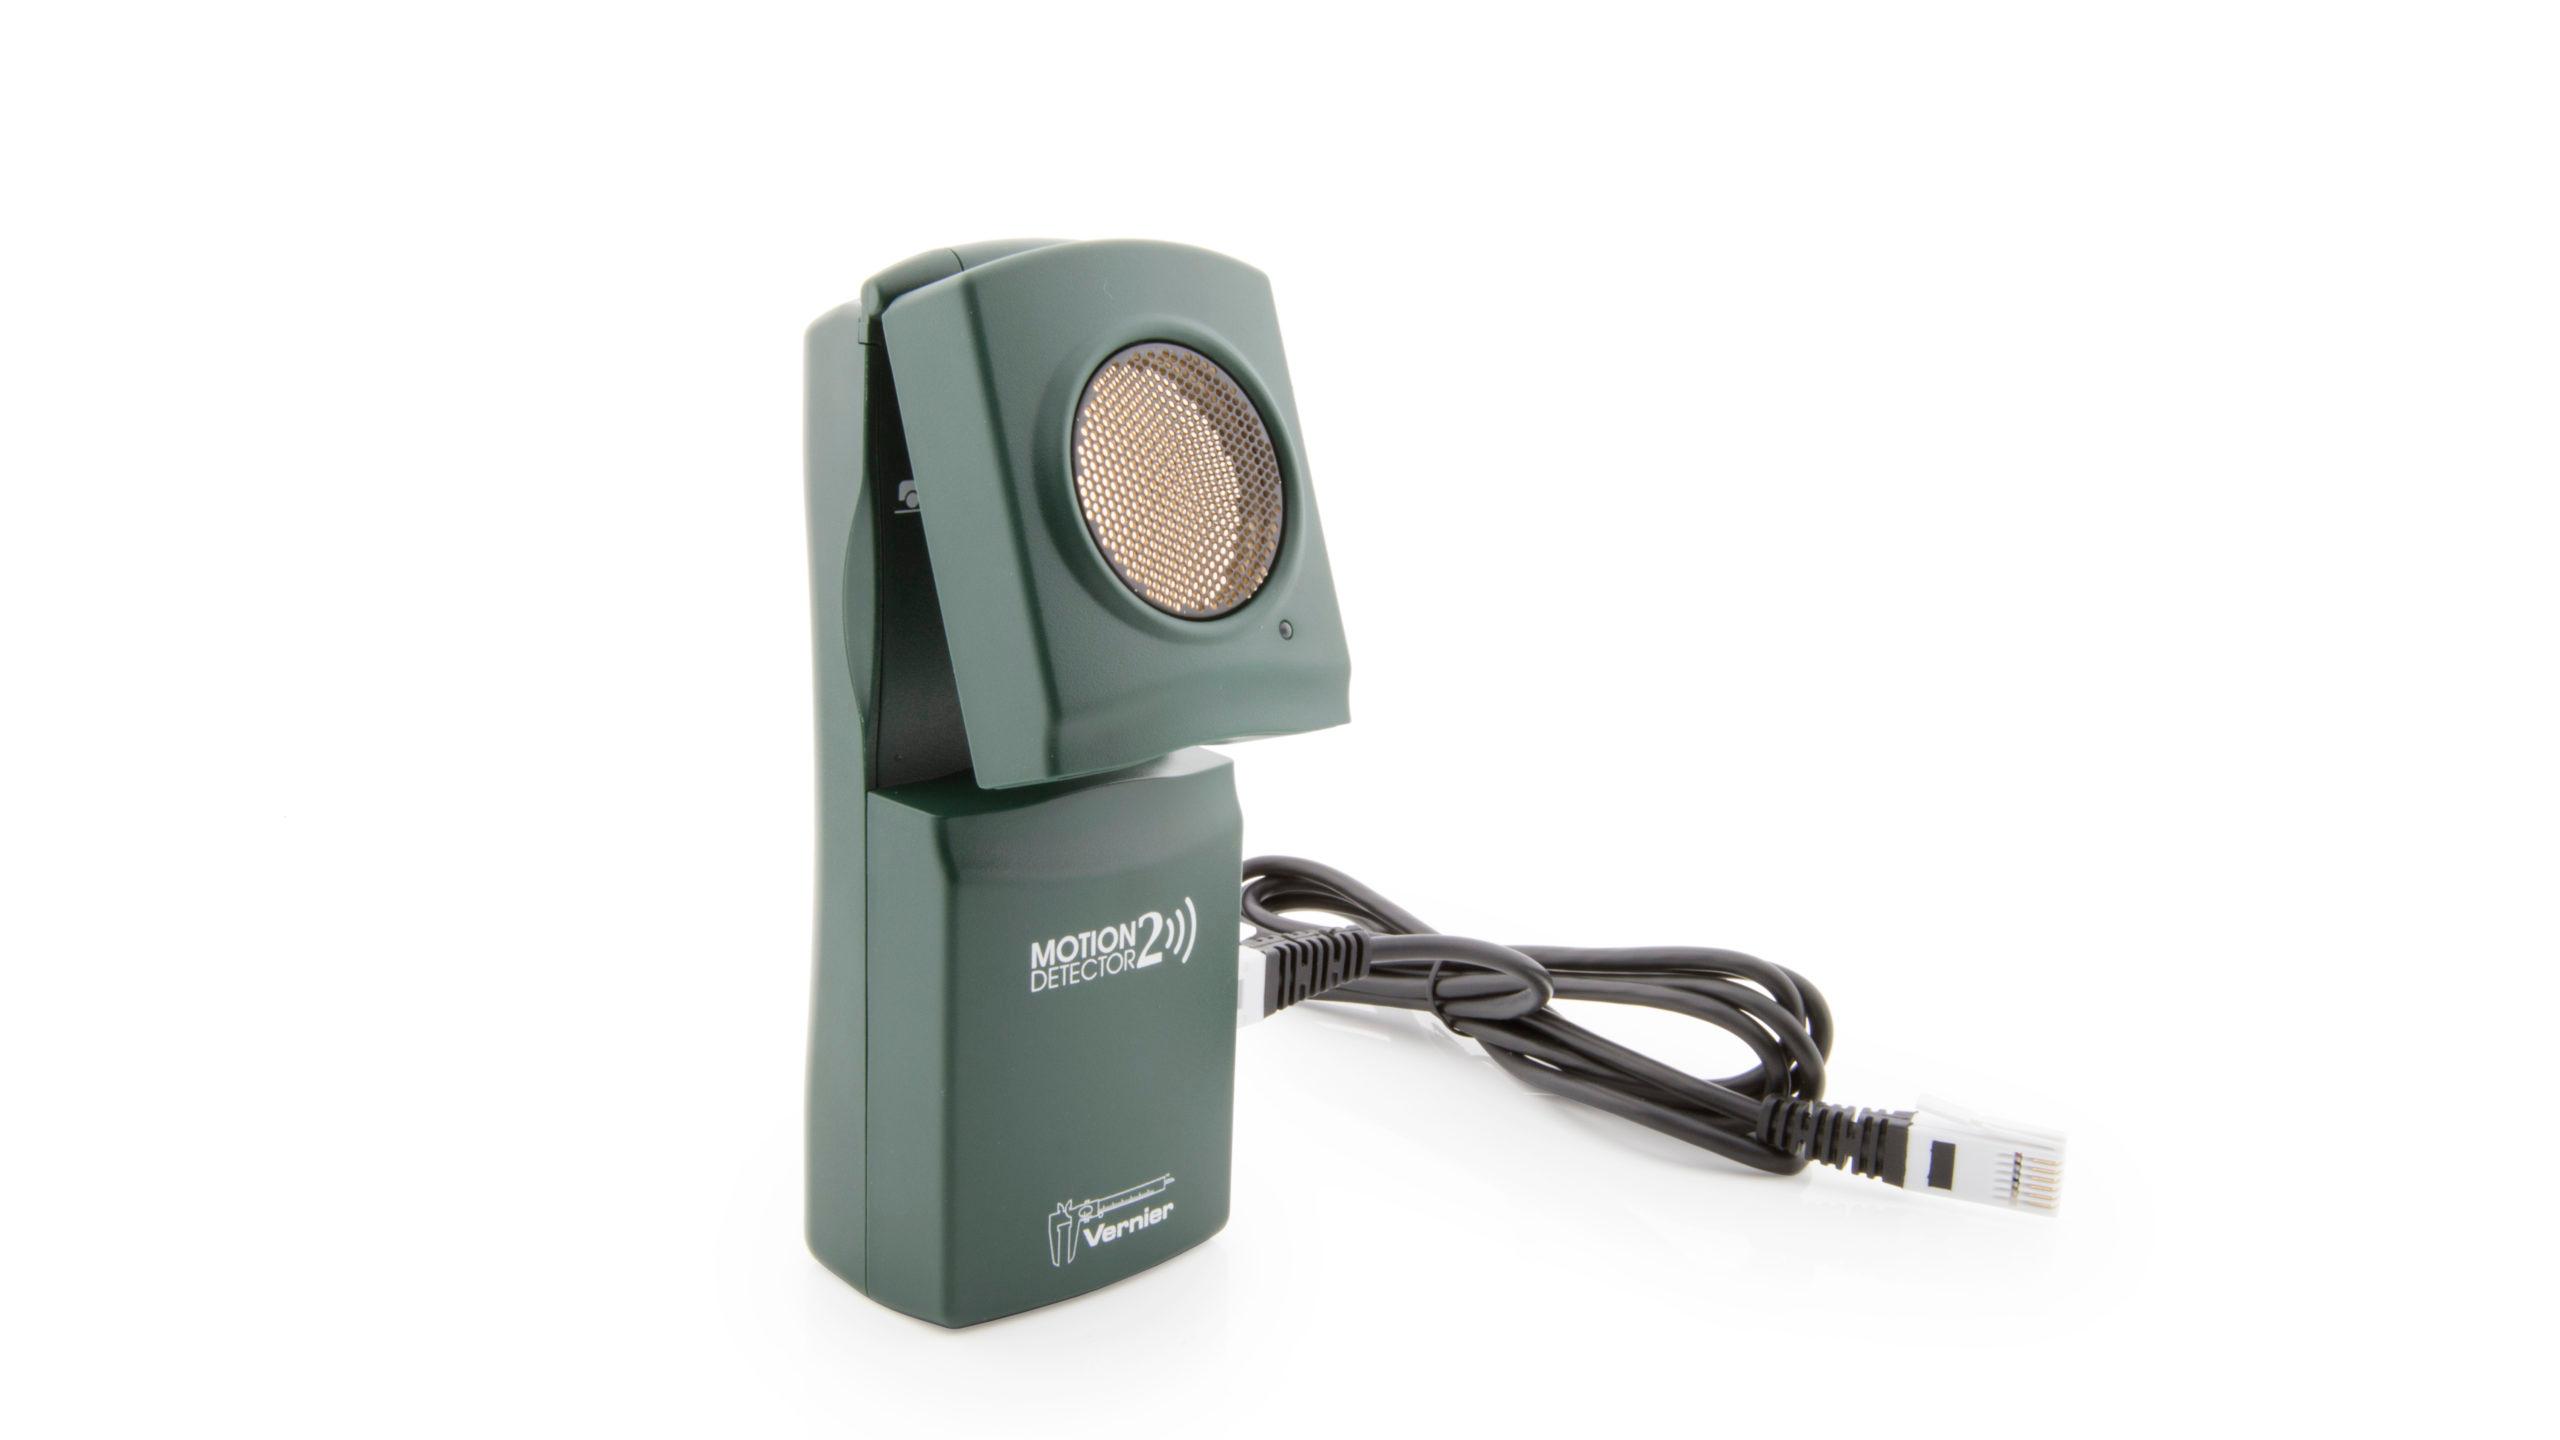
The Motion Detector measures the time it takes for a high-frequency sound pulse to travel from the detector to an object and back. Using this round-trip time and the speed of sound, the interface can determine the distance to the object; that is, its position. It can then use the change in position to calculate the object’s velocity and acceleration. All of this information can be displayed in a graph. A qualitative analysis of the graphs of your motion will help you develop an understanding of the concepts of kinematics.
Objectives
- Analyze the motion of a student walking across the room.
- Predict, sketch, and test position vs. time kinematics graphs.
- Predict, sketch, and test velocity vs. time kinematics graphs.
Sensors and Equipment
This experiment features the following sensors and equipment. Additional equipment may be required.
Ready to Experiment?
Ask an Expert
Get answers to your questions about how to teach this experiment with our support team.
- Call toll-free: 888-837-6437
- Chat with Us
- Email support@vernier.com
Purchase the Lab Book
This experiment is #1 of Physics with Vernier. The experiment in the book includes student instructions as well as instructor information for set up, helpful hints, and sample graphs and data.


