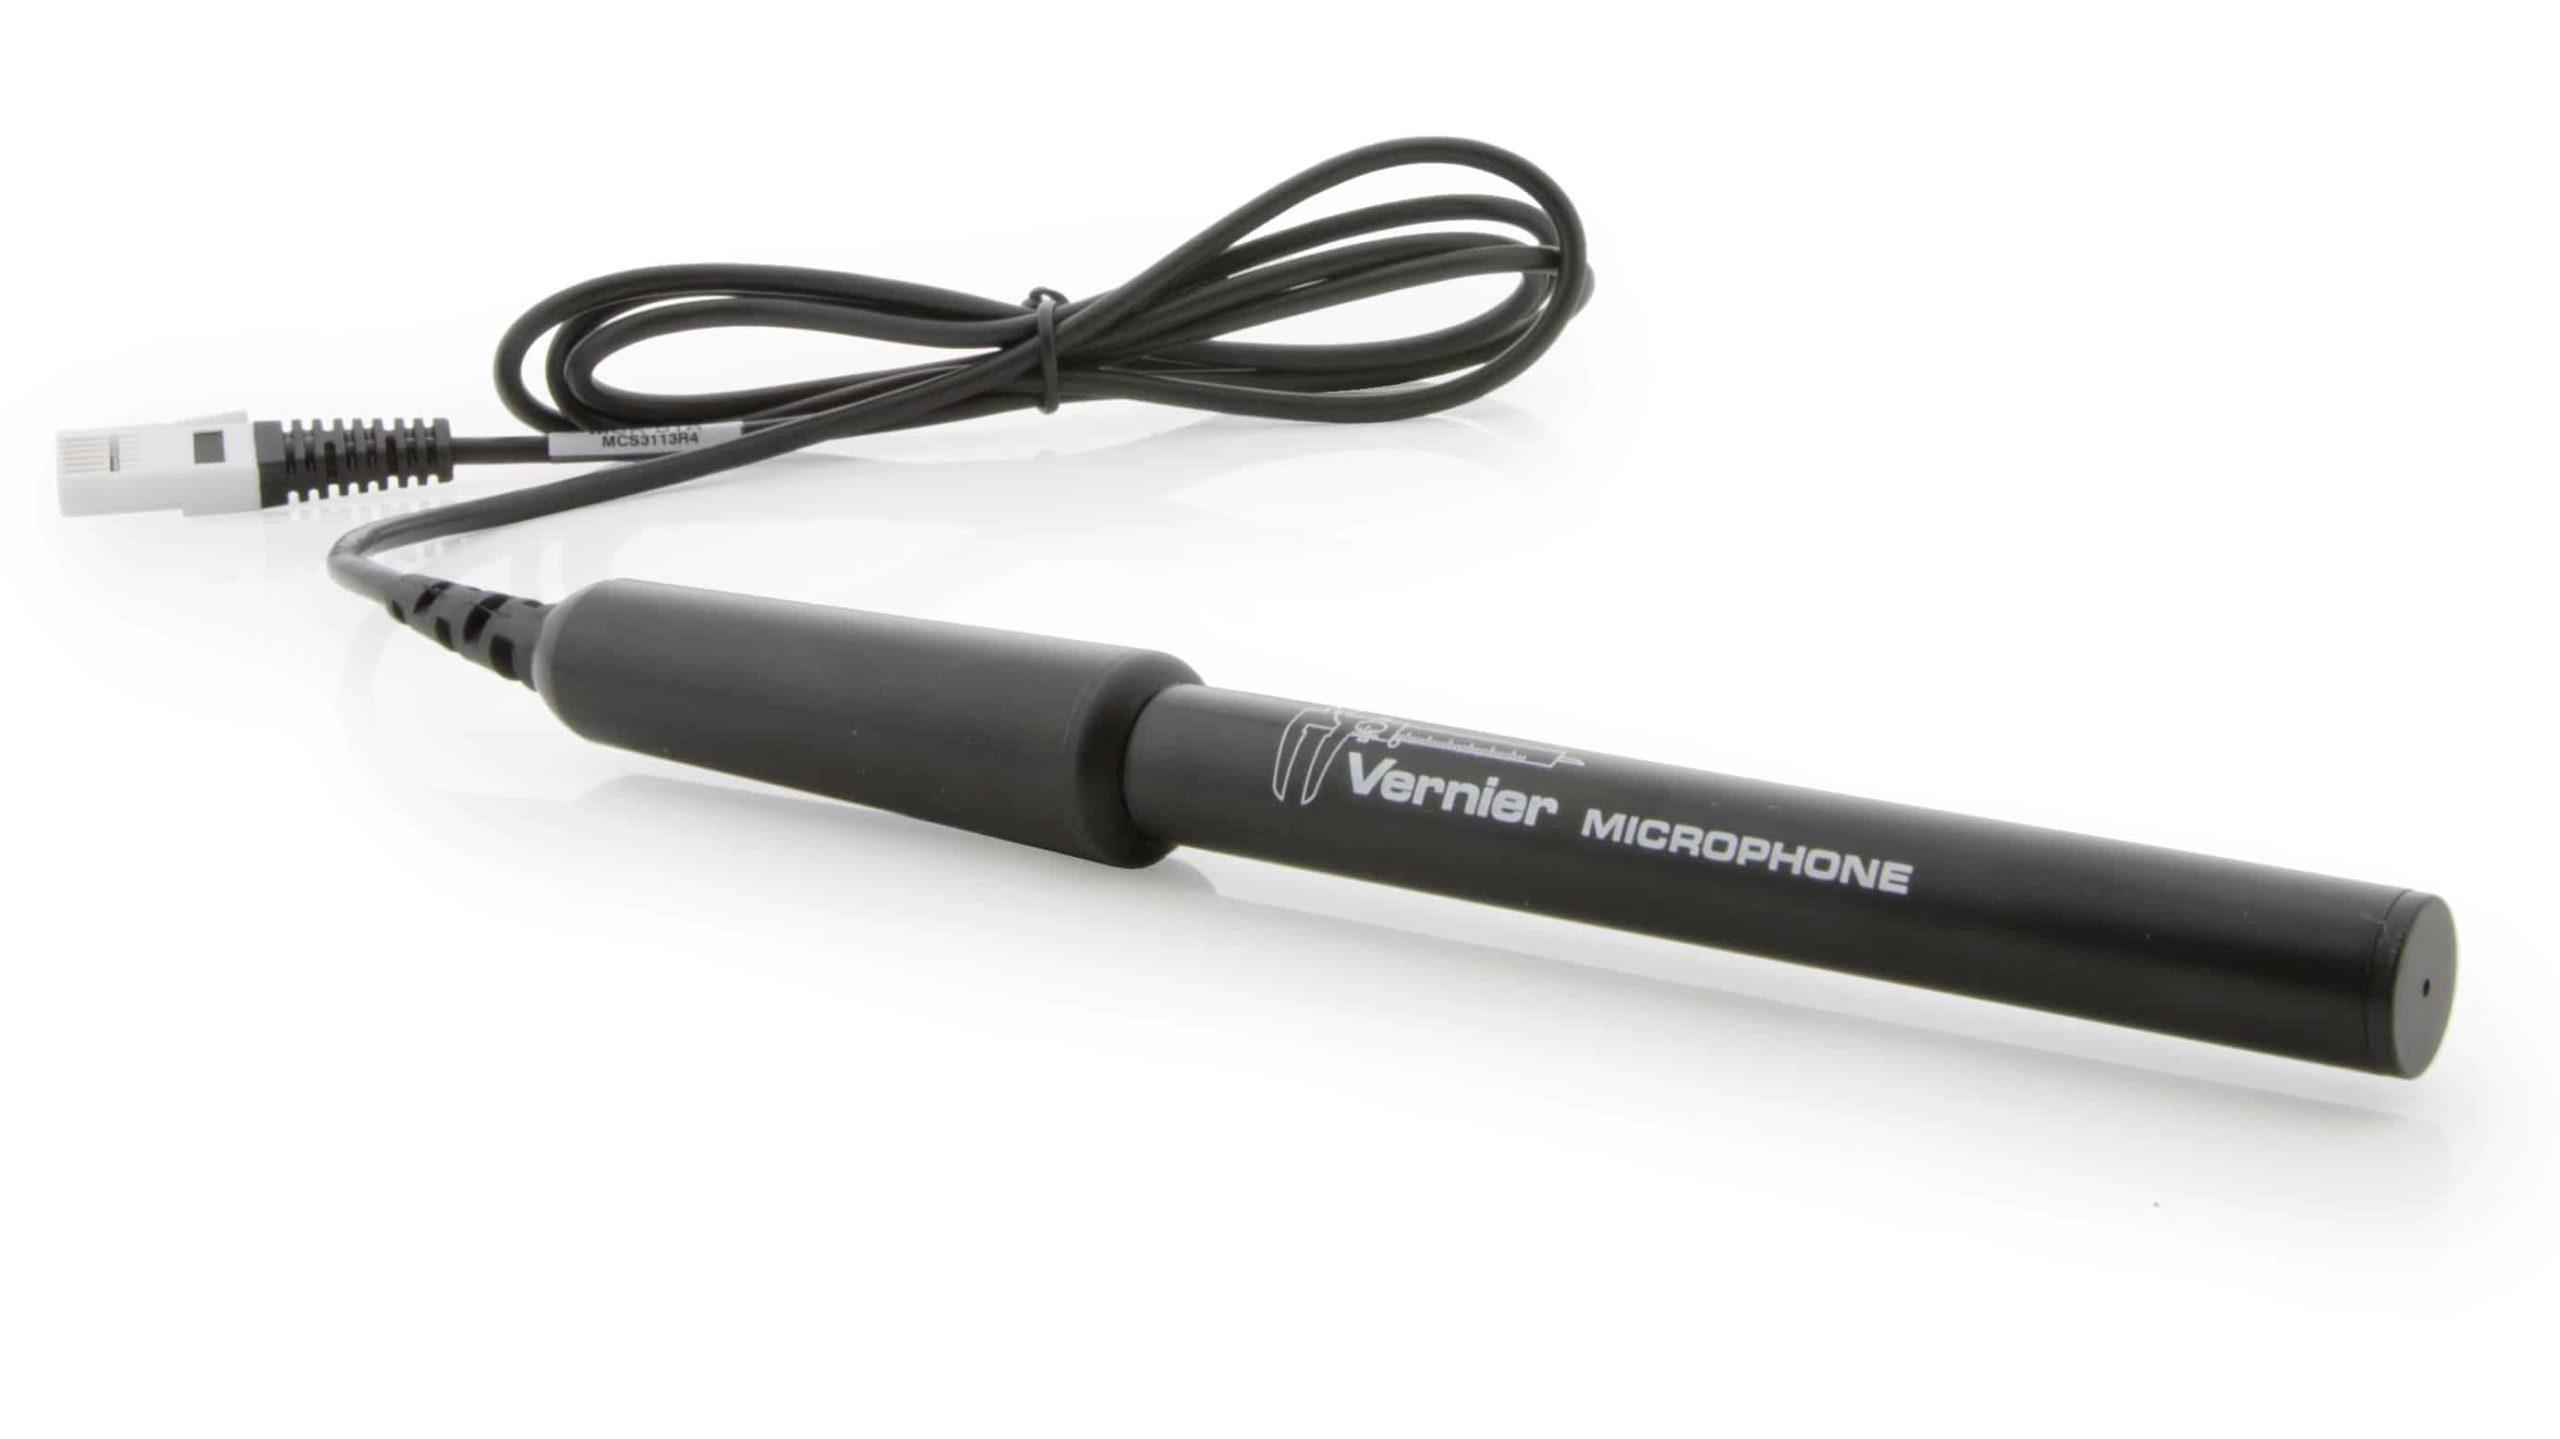
Analyze Microphone Data
Experiment #3 from Hands-On Introduction to NI LabVIEW™ with Vernier
- Subject
- Engineering
Introduction
In the following steps, you will create a program using the Analog Express VI to collect microphone data for a length of 0.05 second at a rate of 10,000 samples/second. The raw microphone data will be displayed on a graph. The program will then apply a low-pass filter to the raw data to reduce the amplitude of the high frequency noise, thus smoothing out the data set. The filtered data are then analyzed to determine the frequency and amplitude of the tone. The filtering and analysis will be programmed using LabVIEW Signal Analysis Express VIs.
Objectives
In this exercise, you will
- Create a LabVIEW VI.
- Incorporate LabVIEW Express Analysis functions.
- Use the Execution Highlight feature to study data flow.
- Display data using numeric and graphical indicators.
Sensors and Equipment
This experiment features the following sensors and equipment. Additional equipment may be required.
Ready to Experiment?
Ask an Expert
Get answers to your questions about how to teach this experiment with our support team.
- Call toll-free: 888-837-6437
- Chat with Us
- Email support@vernier.com
Purchase the Lab Book
This experiment is #3 of Hands-On Introduction to NI LabVIEW™ with Vernier. The experiment in the book includes student instructions as well as instructor information for set up, helpful hints, and sample graphs and data.


