Analysis of Running with Resistance
Experiment #8 from Vernier Video Analysis: Motion and Sports
- Subject
- Physics

Introduction
Runners often add elements to their training routine that create increased resistance to help build strength and speed. Running parachutes work to create drag on a runner in the same way that parachutes on race cars do. The runner must work harder to overcome the drag, leading to a greater load on the muscles as they exercise.
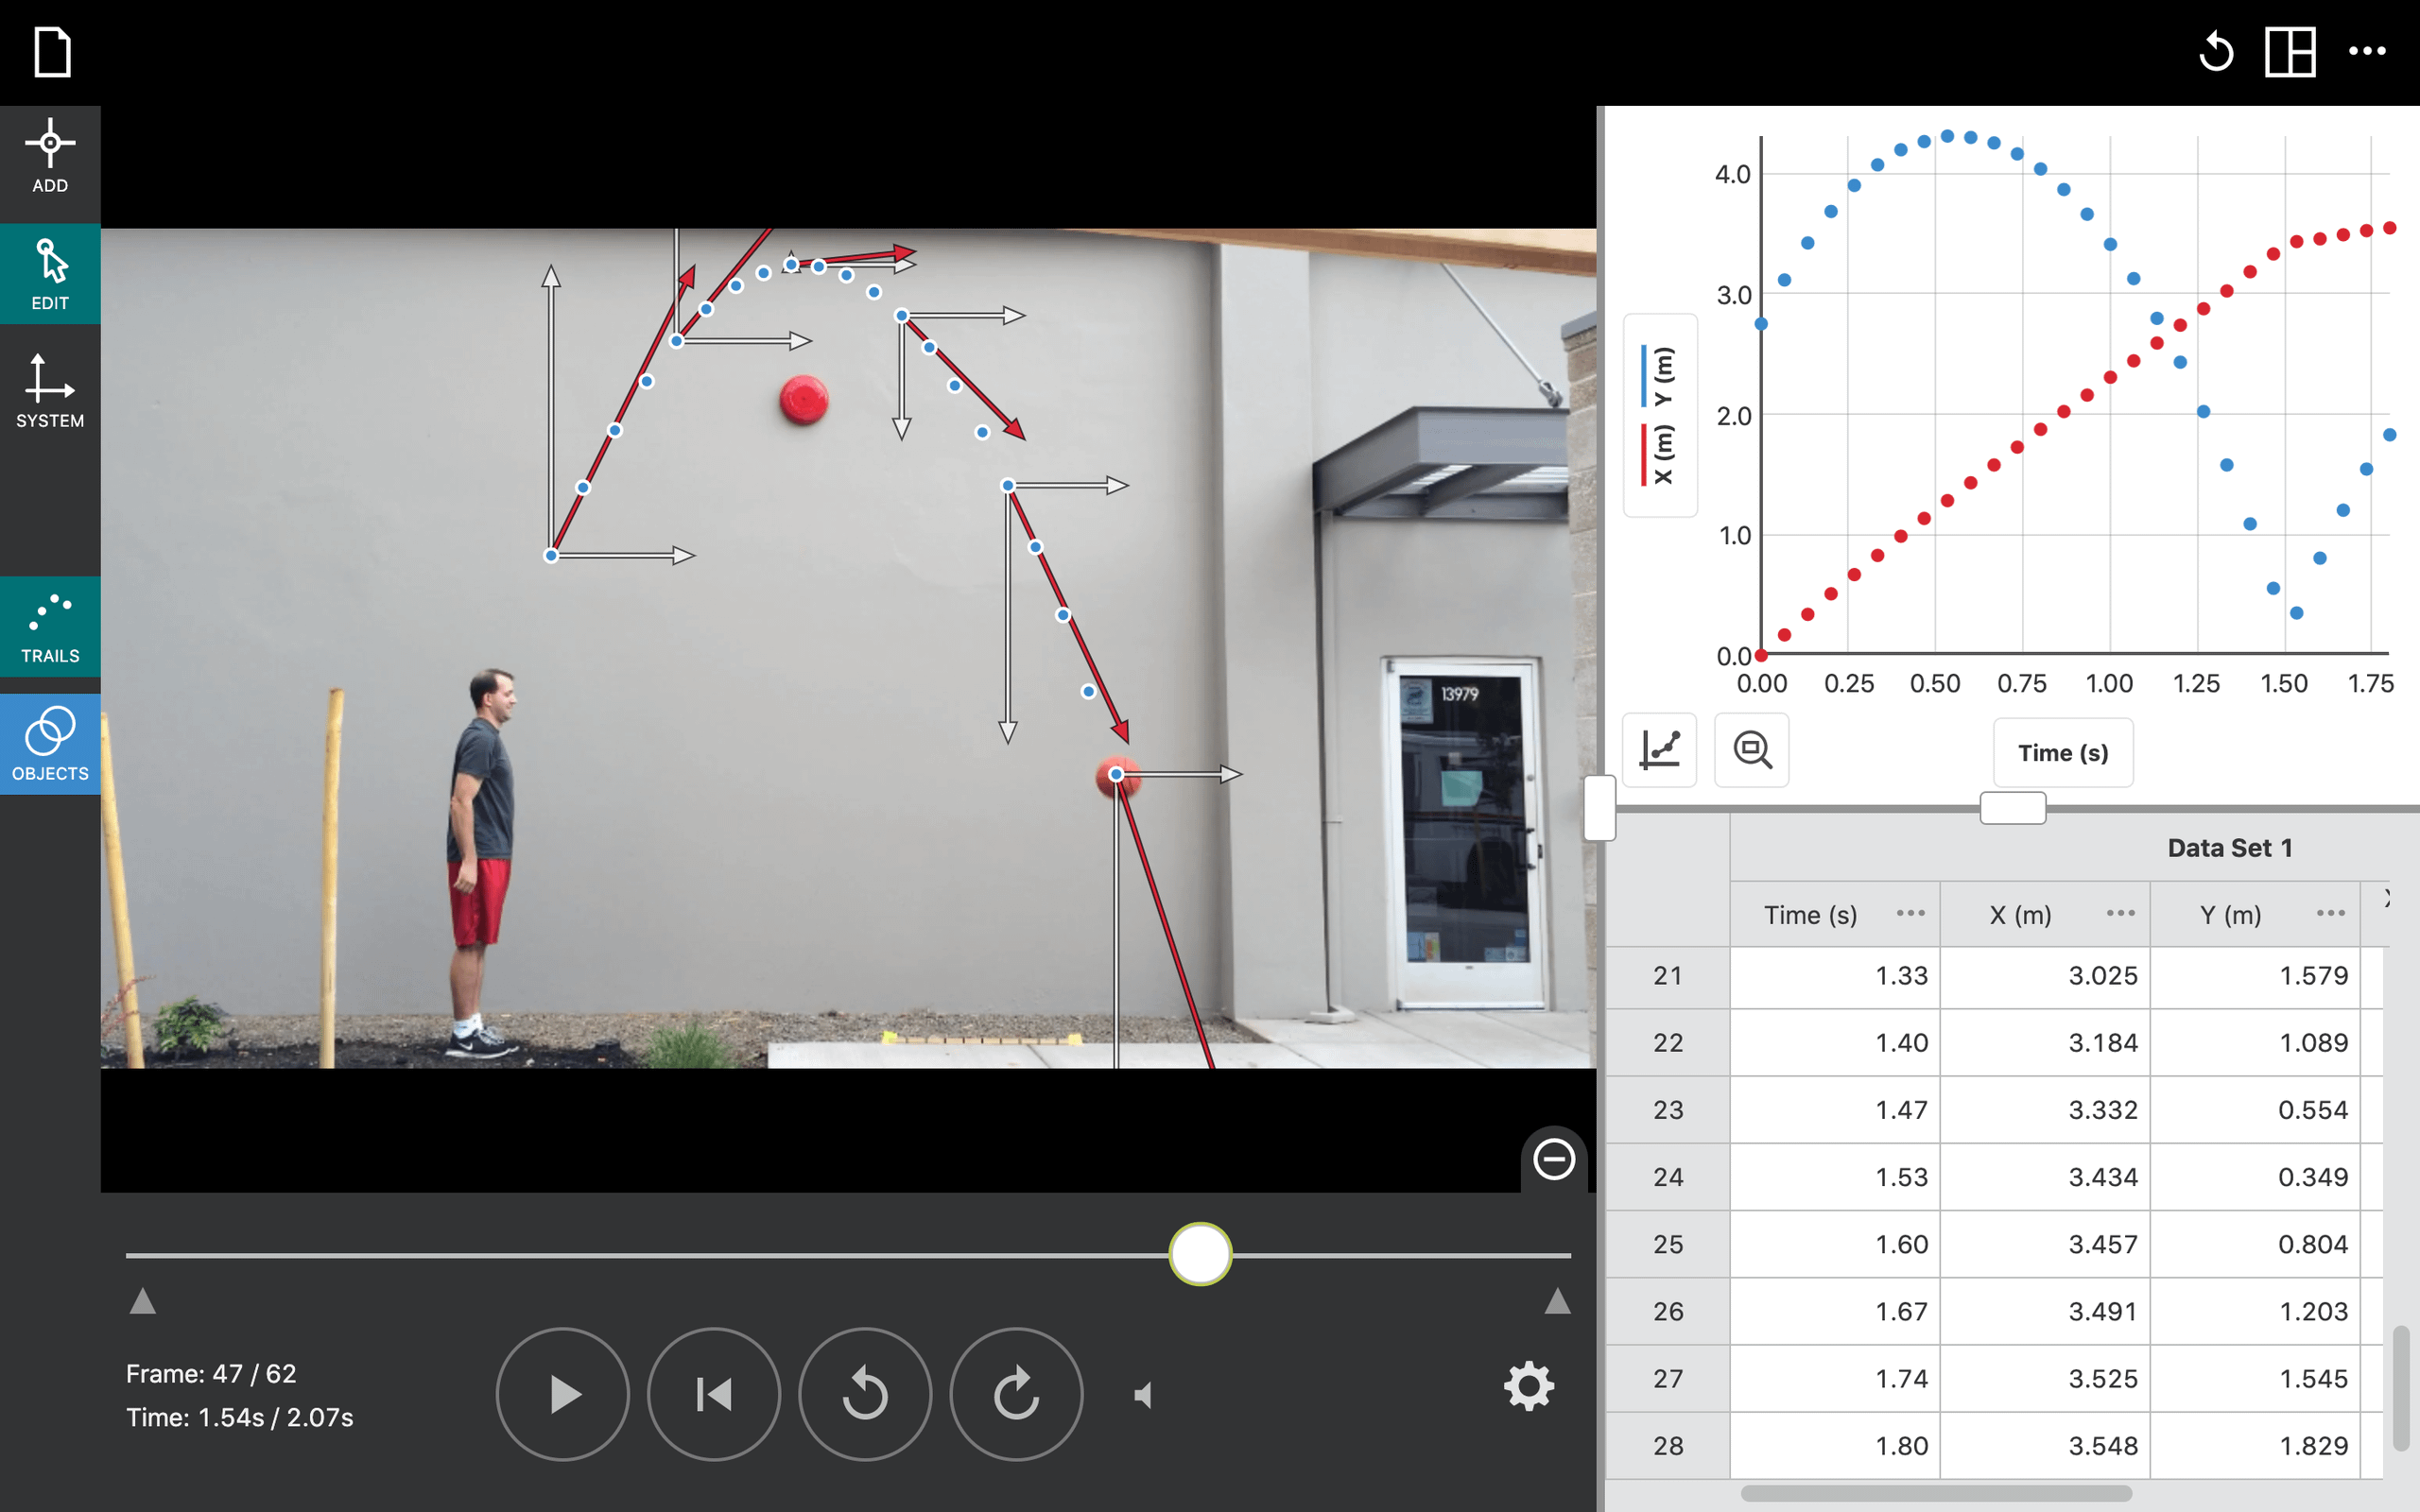
In this activity, you will analyze the horizontal motion of a person running as drag is increased. Using the Vernier Video Analysis app, you will compare features of the position vs. time and velocity vs. time graphs as drag is increased on the runner.
Objectives
In this experiment, you will
- Use video analysis techniques to obtain position, velocity, and time data for a person sprinting with and without running parachutes.
- Analyze the position vs. time and velocity vs. time graphs for the runner as they sprint with increasing amounts of drag.
- Use video analysis techniques to obtain position of the foot data for a runner as they sprint with increasing amounts of drag.
- Determine step rate, cadence, and stride length for a person sprinting with increasing amounts of drag.
- [Extensions] Create and analyze your own video of a person sprinting with increasing drag.
Sensors and Equipment
This experiment features the following sensors and equipment. Additional equipment may be required.
Correlations
Teaching to an educational standard? This experiment supports the standards below.
- International Baccalaureate (IB)/Sports, Exercise, and Health Science
- 10. Friction and drag
Ready to Experiment?
Ask an Expert
Get answers to your questions about how to teach this experiment with our support team.
- Call toll-free: 888-837-6437
- Chat with Us
- Email support@vernier.com
Purchase the Lab Book
This experiment is #8 of Vernier Video Analysis: Motion and Sports. The experiment in the book includes student instructions as well as instructor information for set up, helpful hints, and sample graphs and data.


