Introduction
Up to this point, it is likely that you have examined the motion of an object in one dimension—either on a horizontal or inclined surface, or falling vertically under the influence of Earth’s gravity. Using the same tools and relationships, you can also examine the more complex motion of a human moving across a horizontal surface.
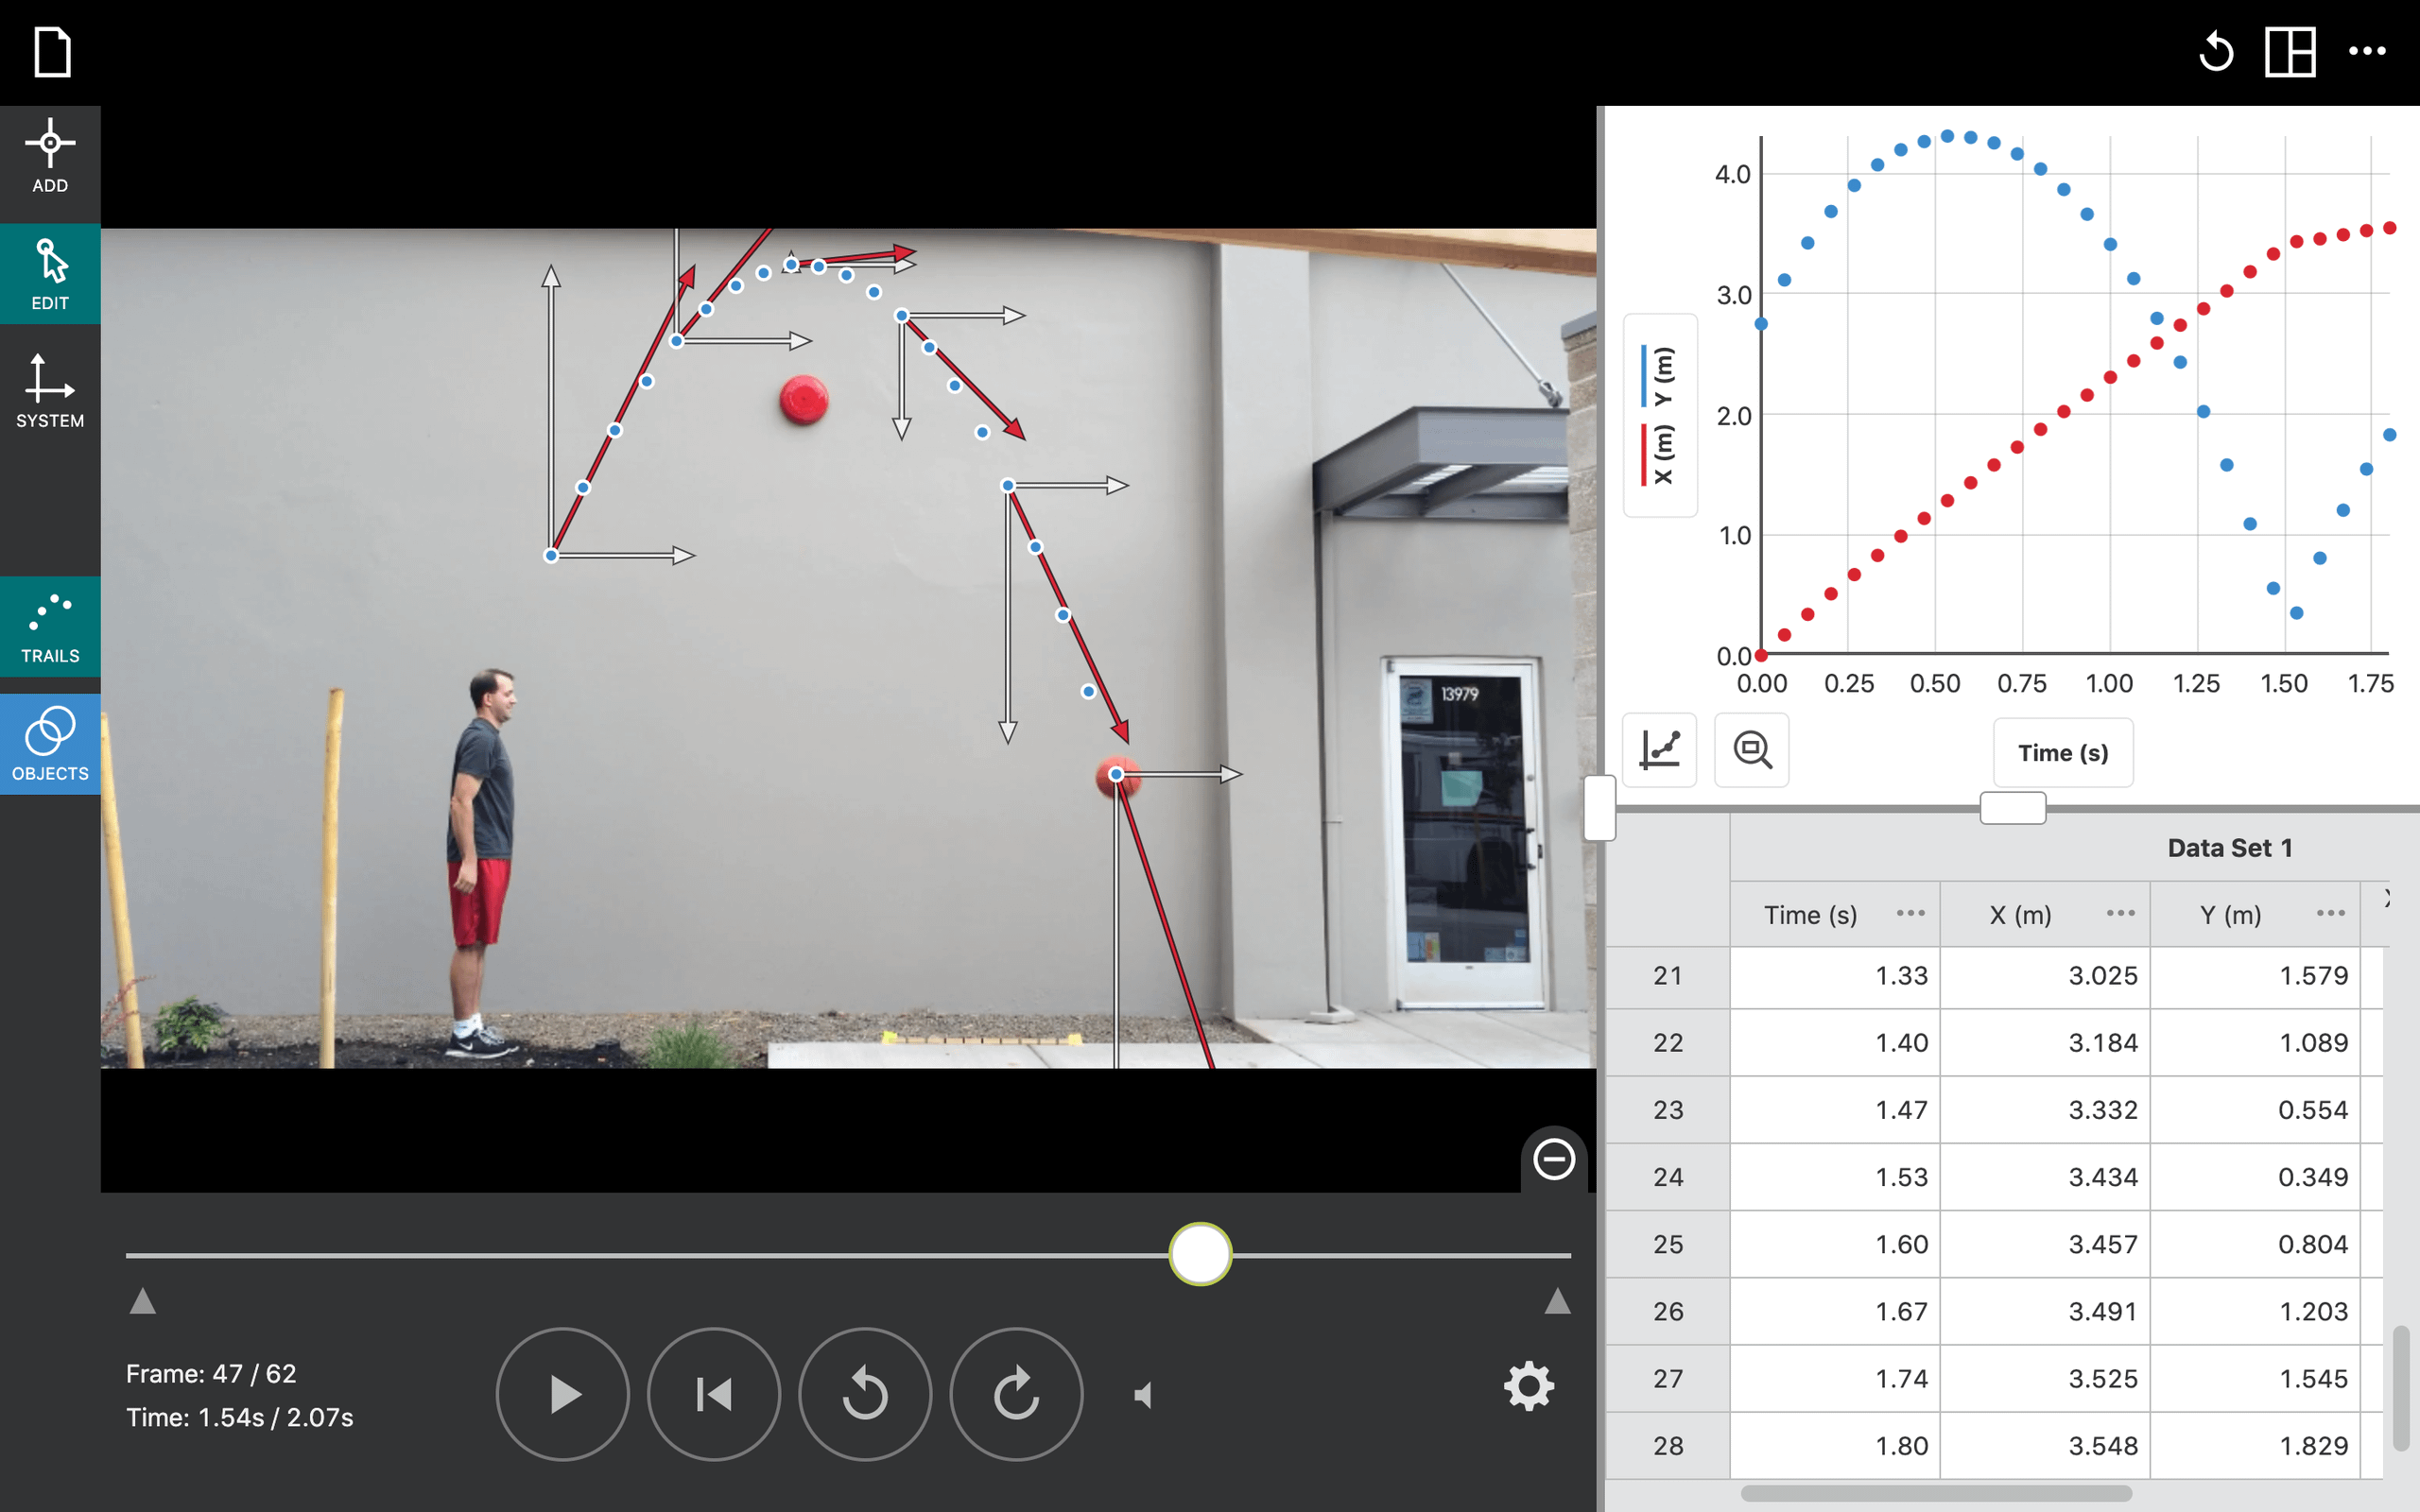
Jogging, running, and sprinting are three ways of describing running at different speeds. “Jogging” is running at a slow pace that can be maintained for long periods. “Sprinting” is running at maximal effort. “Running” is some in-between pace. Using the Vernier Video Analysis app, you will compare features of the position vs. time and velocity vs. time graphs as the runner increases their speed during each type of motion.
Objectives
In this experiment, you will
- Use video analysis techniques to obtain position, velocity, and time data for a person jogging, running, and sprinting.
- Analyze the position vs. time and velocity vs. time graphs for the person as they move.
- Use video analysis techniques to obtain position of the foot for a person jogging, running, and sprinting.
- Determine step rate, cadence, and stride length for a person jogging, running, and sprinting.
- [Extensions] Create and analyze your own video of a person walking, jogging, running, and sprinting.
Sensors and Equipment
This experiment features the following sensors and equipment. Additional equipment may be required.
Correlations
Teaching to an educational standard? This experiment supports the standards below.
- International Baccalaureate (IB)/Sports, Exercise, and Health Science
- 4.2 Joint and movement type
Ready to Experiment?
Ask an Expert
Get answers to your questions about how to teach this experiment with our support team.
- Call toll-free: 888-837-6437
- Chat with Us
- Email support@vernier.com
Purchase the Lab Book
This experiment is #3 of Vernier Video Analysis: Motion and Sports. The experiment in the book includes student instructions as well as instructor information for set up, helpful hints, and sample graphs and data.


