Determining the Phosphoric Acid Content in Soft Drinks
Experiment #35 from Chemistry with Vernier
- Education Level
- High School
- Subject
- Chemistry

Introduction
Phosphoric acid is one of several weak acids that exist in carbonated beverages. It is a component of all cola soft drinks. Phosphoric acid has a much higher concentration than other acids in a container of soft drink, so its concentration can be determined by a simple acid-base titration.
In this experiment, you will titrate a sample of a cola soft drink with sodium hydroxide solution and determine the concentration of phosphoric acid, H3PO4. Hydrogen ions from the first dissociation of phosphoric acid react with hydroxide ions from the NaOH in a one-to-one ratio in the overall reaction:
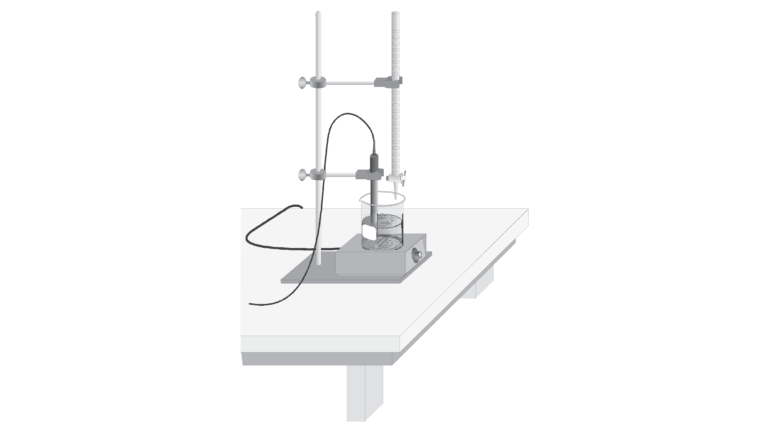
In this experiment, you will use a pH Sensor to monitor pH as you titrate. The region of most rapid pH change will then be used to determine the equivalence point. The volume of NaOH titrant used at the equivalence point will be used to determine the molarity of the H3PO4.
Objectives
In this experiment, you will
- Use a pH Sensor to monitor pH during the titration of phosphoric acid in a cola soft drink.
- Using the titration equivalence point, determine the molarity of H3PO4.
Sensors and Equipment
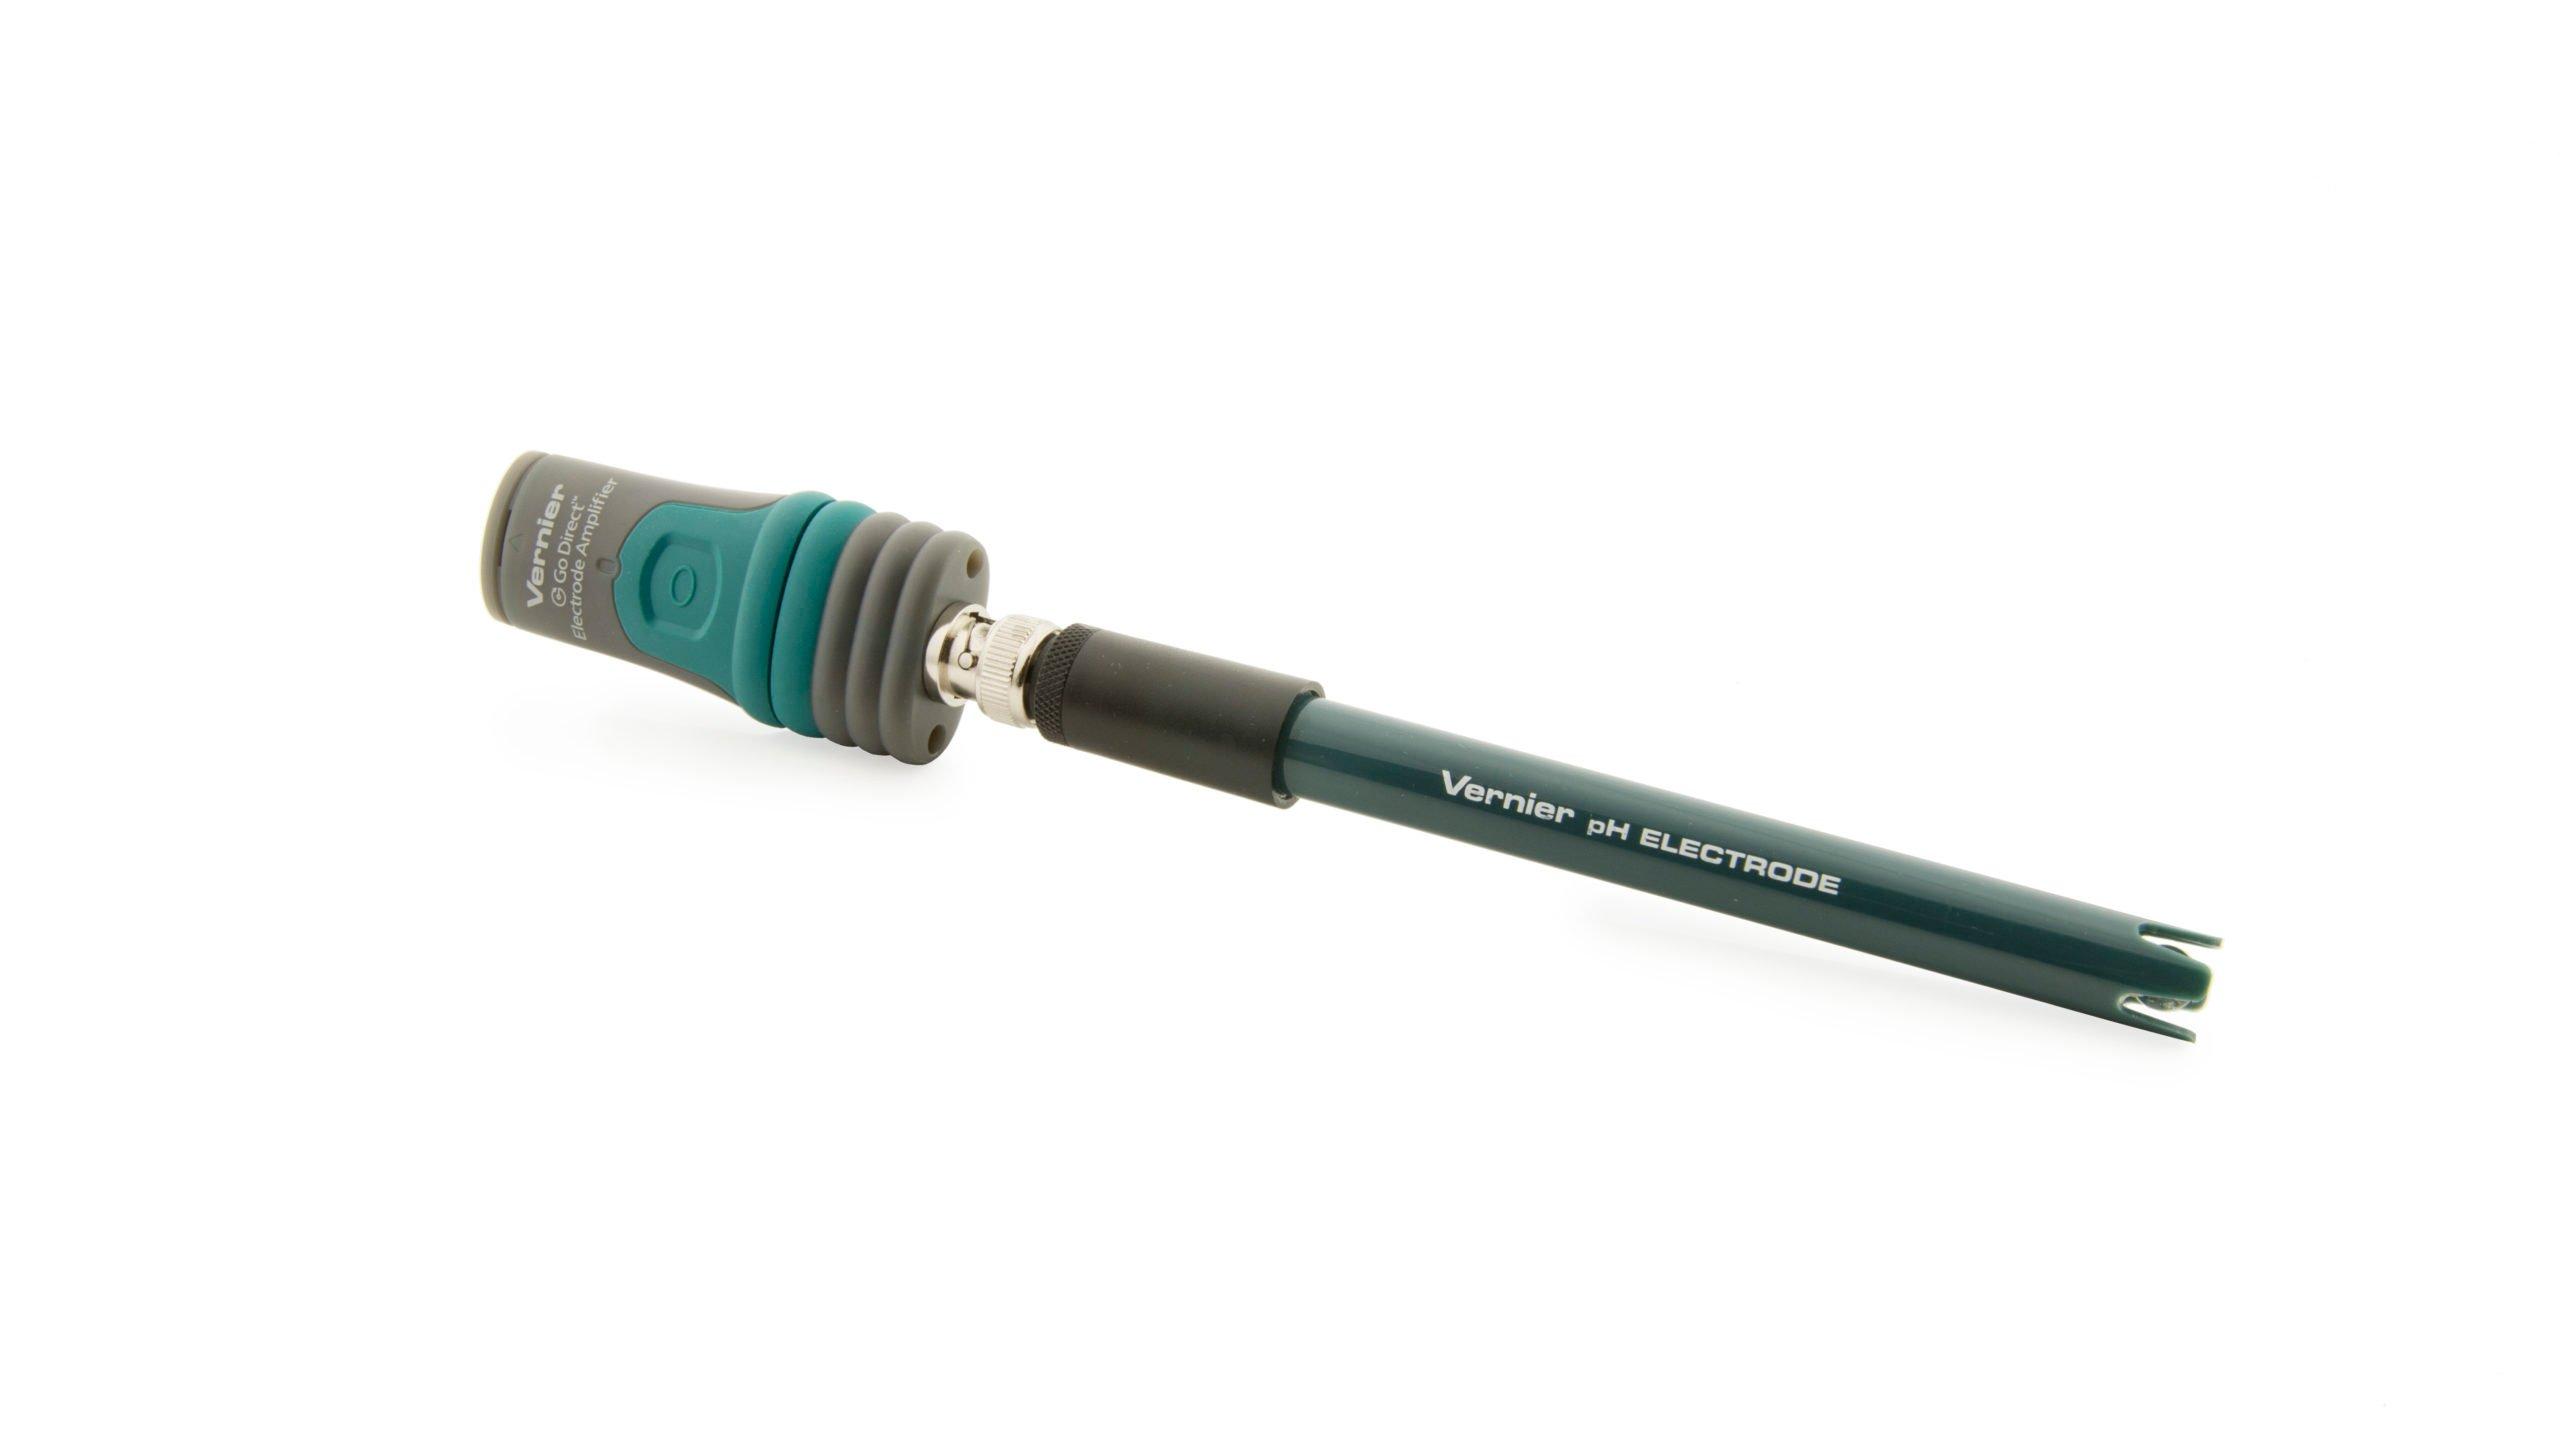
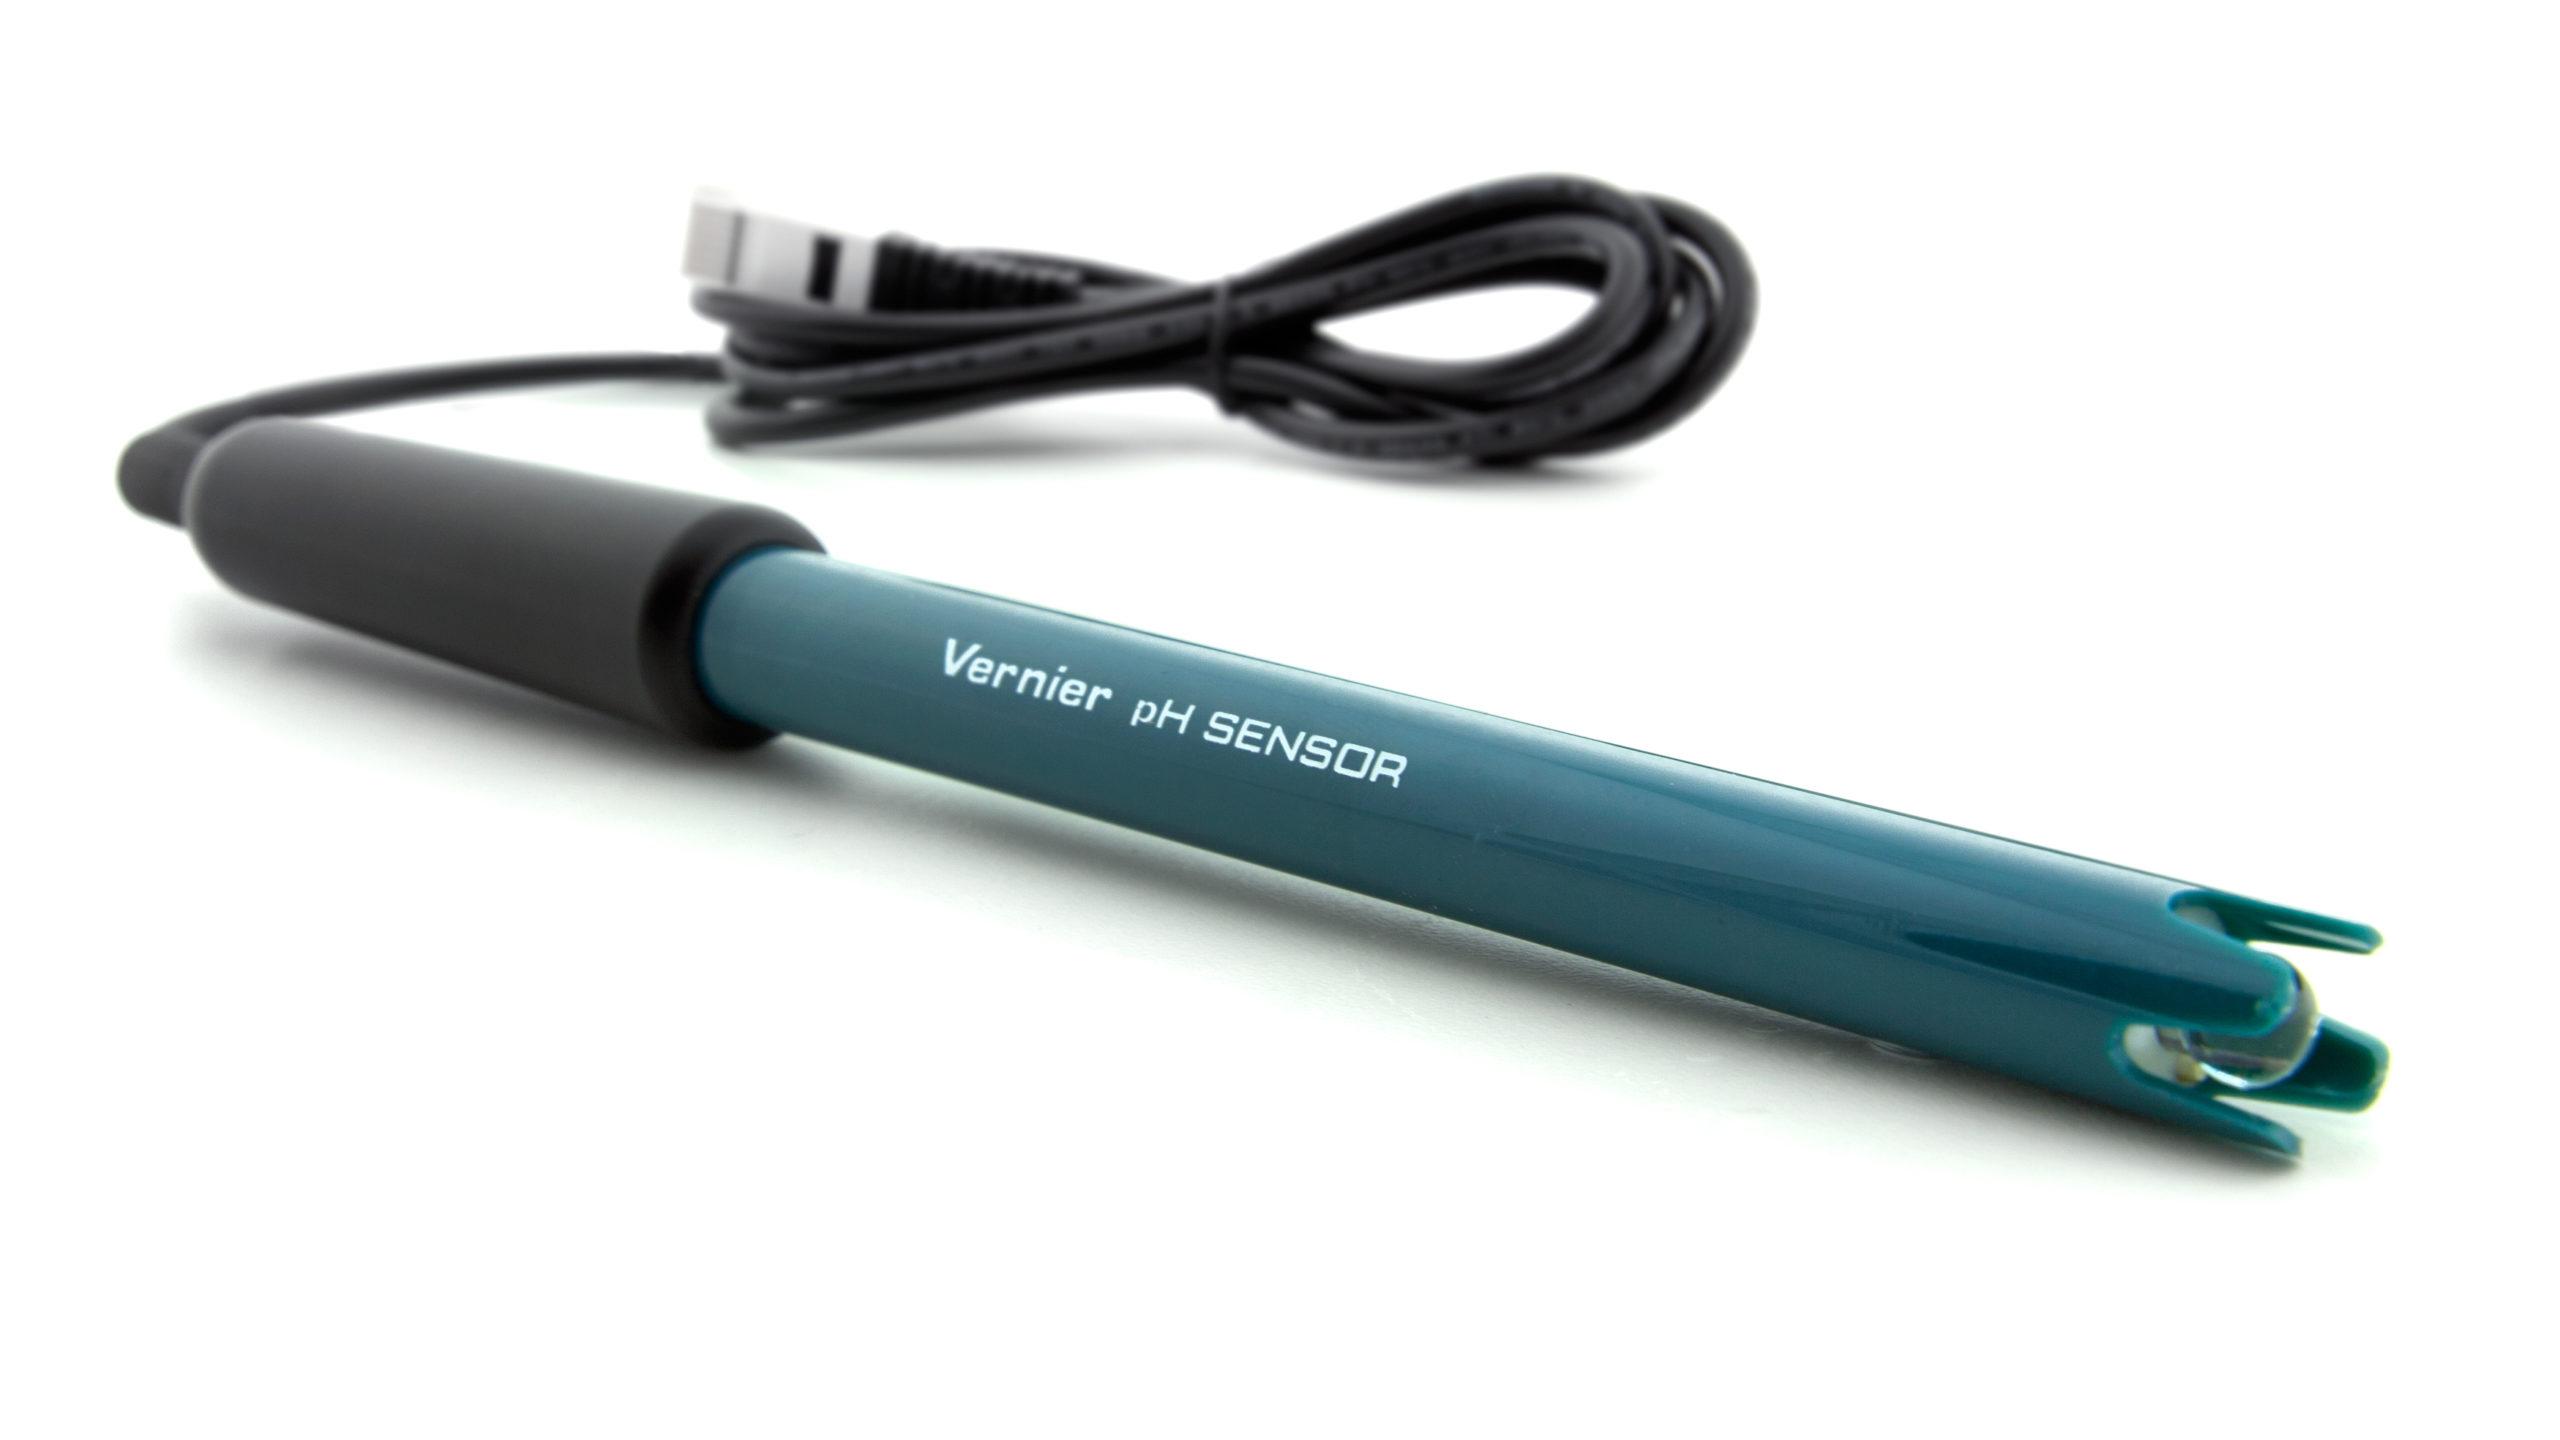
This experiment features the following sensors and equipment. Additional equipment may be required.
Option 1

Option 2

Ready to Experiment?
Ask an Expert
Get answers to your questions about how to teach this experiment with our support team.
- Call toll-free: 888-837-6437
- Chat with Us
- Email support@vernier.com
Purchase the Lab Book
This experiment is #35 of Chemistry with Vernier. The experiment in the book includes student instructions as well as instructor information for set up, helpful hints, and sample graphs and data.


