Introduction
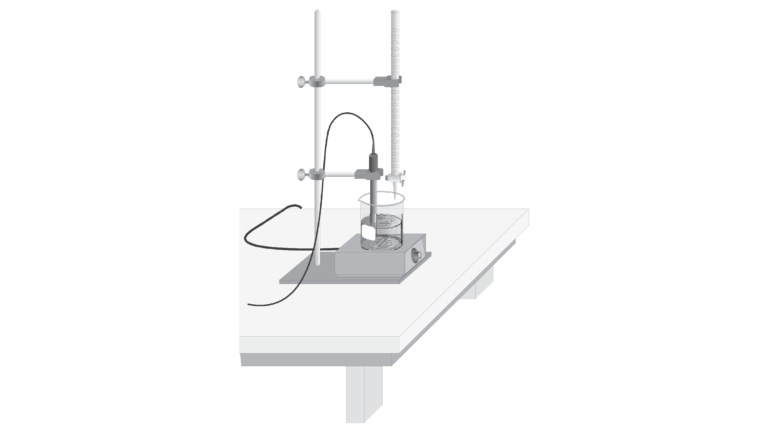
A titration is a process used to determine the volume of a solution needed to react with a given amount of another substance. In this experiment, you will titrate hydrochloric acid solution, HCl, with a basic sodium hydroxide solution, NaOH. The concentration of the NaOH solution is given and you will determine the unknown concentration of the HCl. Hydrogen ions from the HCl react with hydroxide ions from the NaOH in a one-to-one ratio to produce water in the overall reaction:
When an HCl solution is titrated with an NaOH solution, the pH of the acidic solution is initially low. As base is added, the change in pH is quite gradual until close to the equivalence point, when equimolar amounts of acid and base have been mixed. Near the equivalence point, the pH increases very rapidly. The change in pH then becomes more gradual again, before leveling off with the addition of excess base.
In this experiment, you will use a computer to monitor pH as you titrate. The region of most rapid pH change will then be used to determine the equivalence point. The volume of NaOH titrant used at the equivalence point will be used to determine the molarity of the HCl.
Objectives
In this experiment, you will
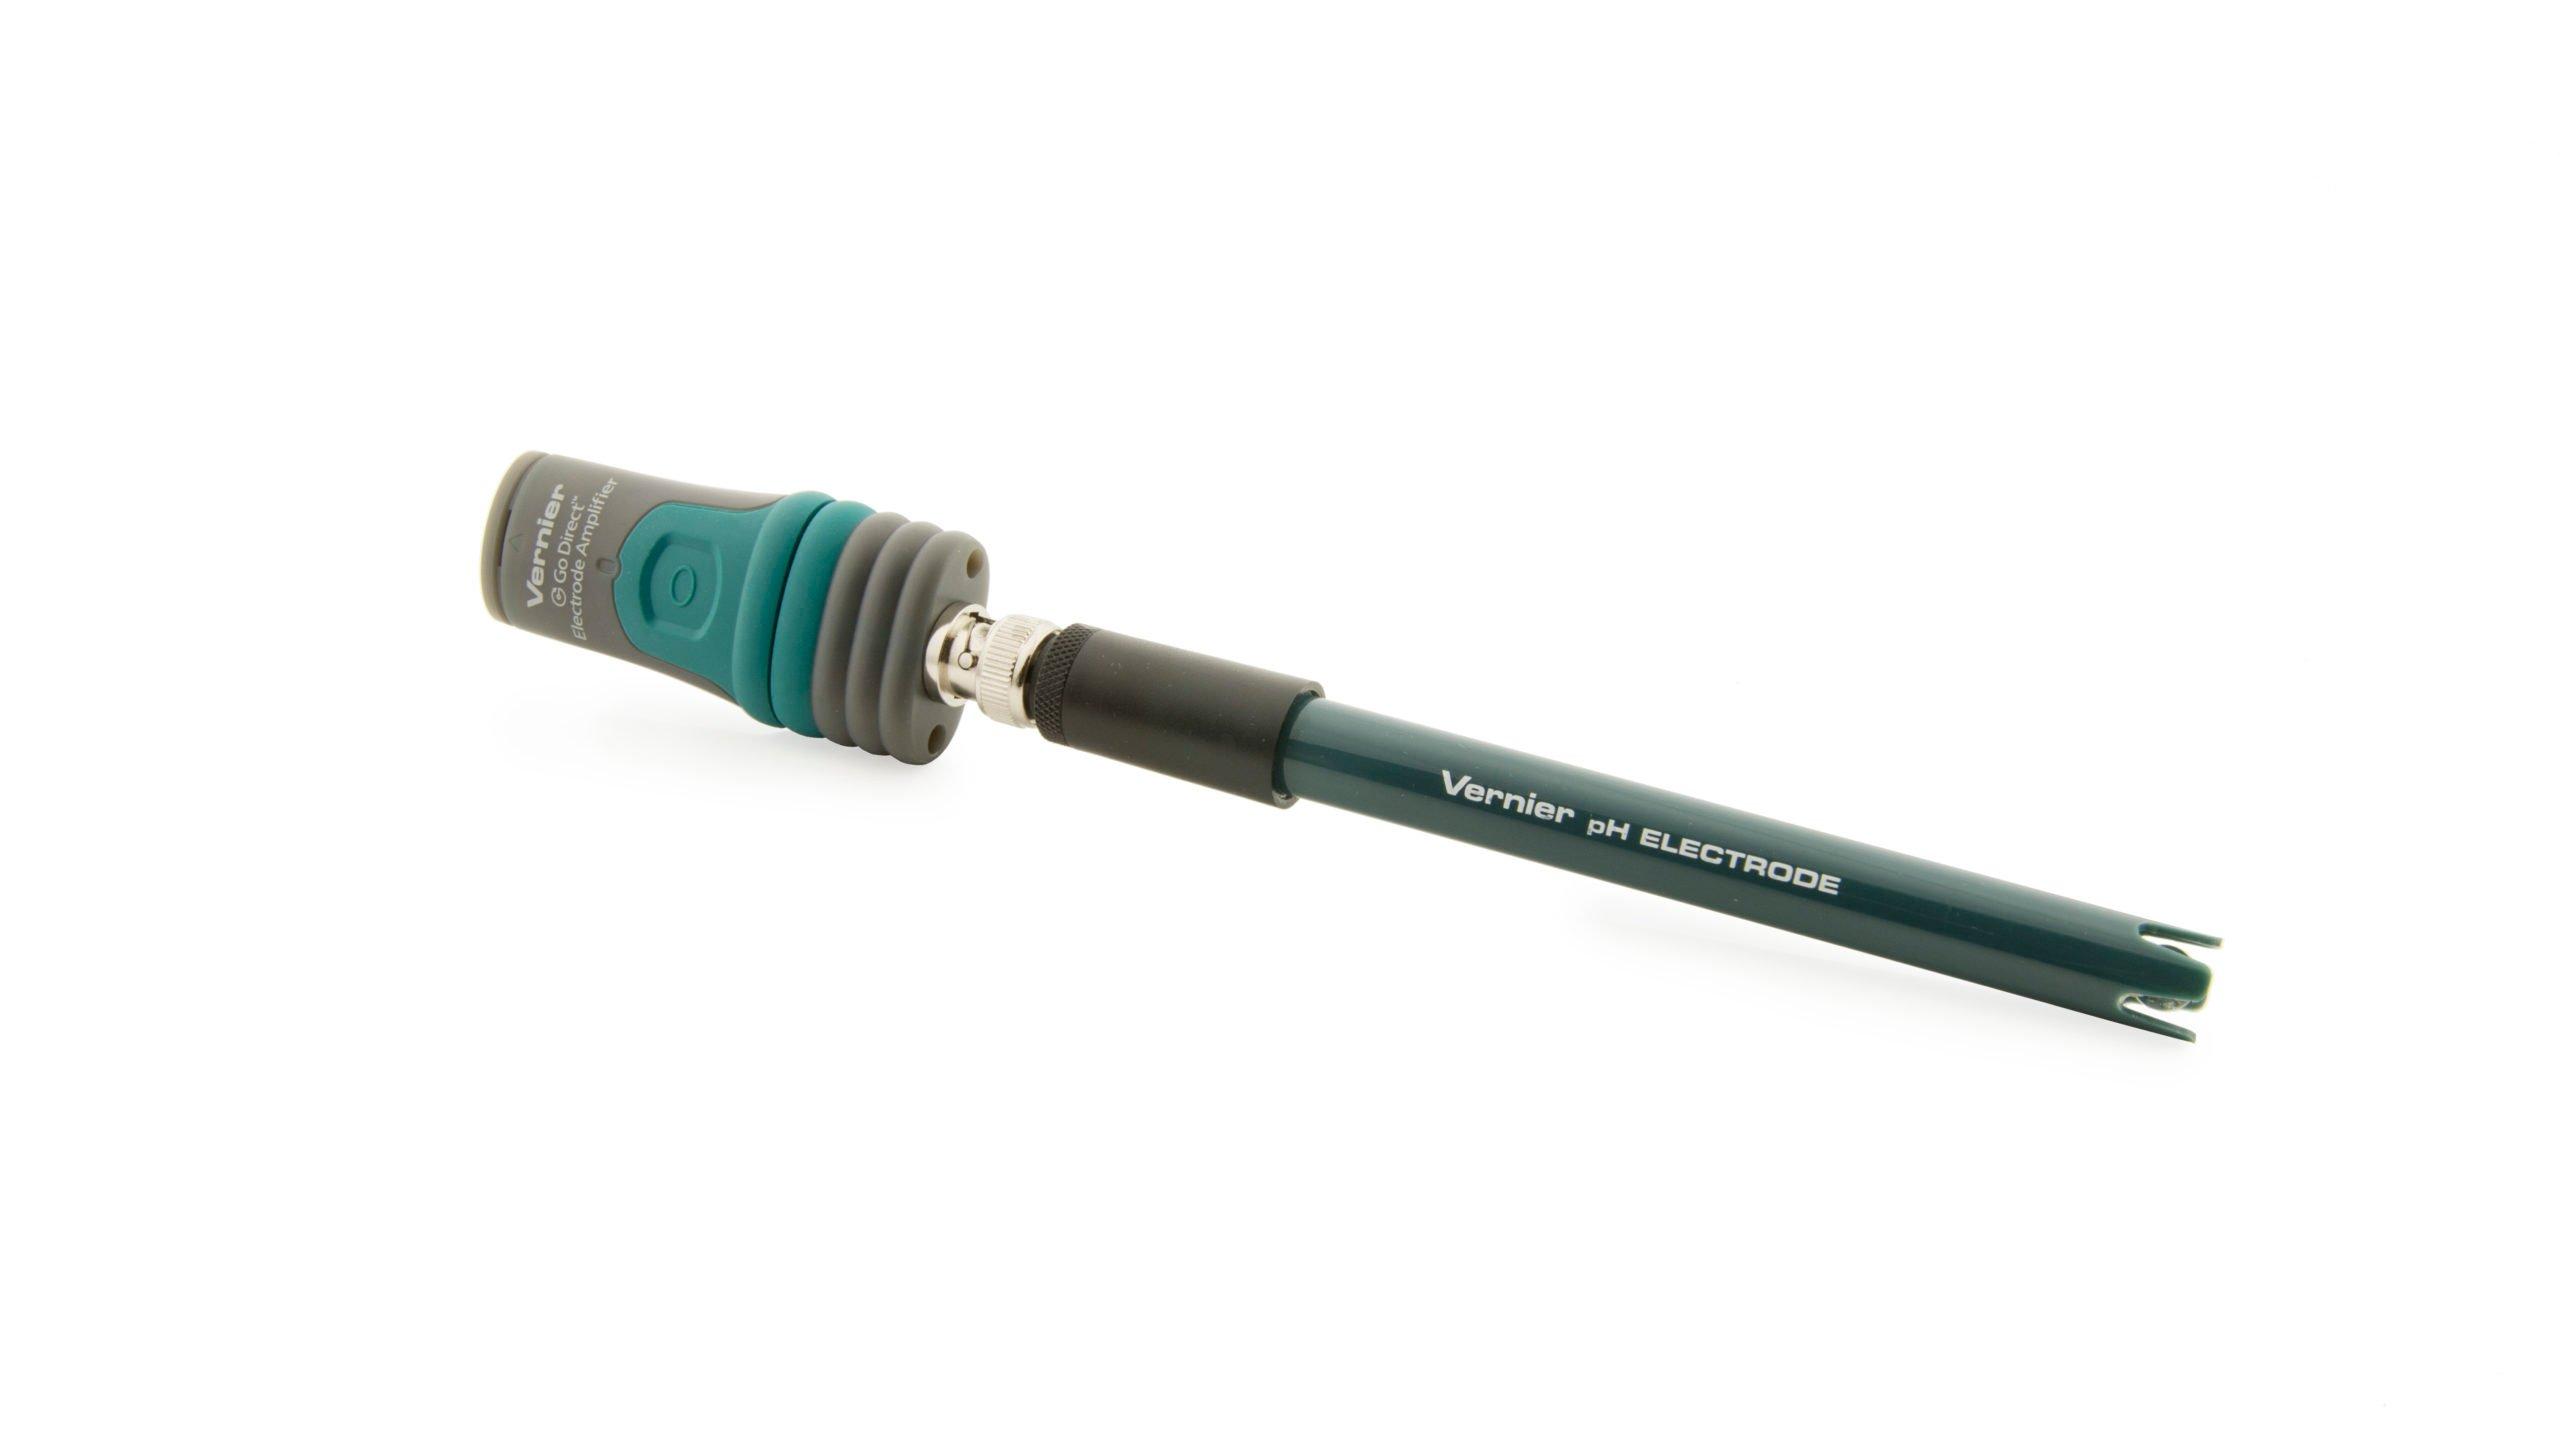
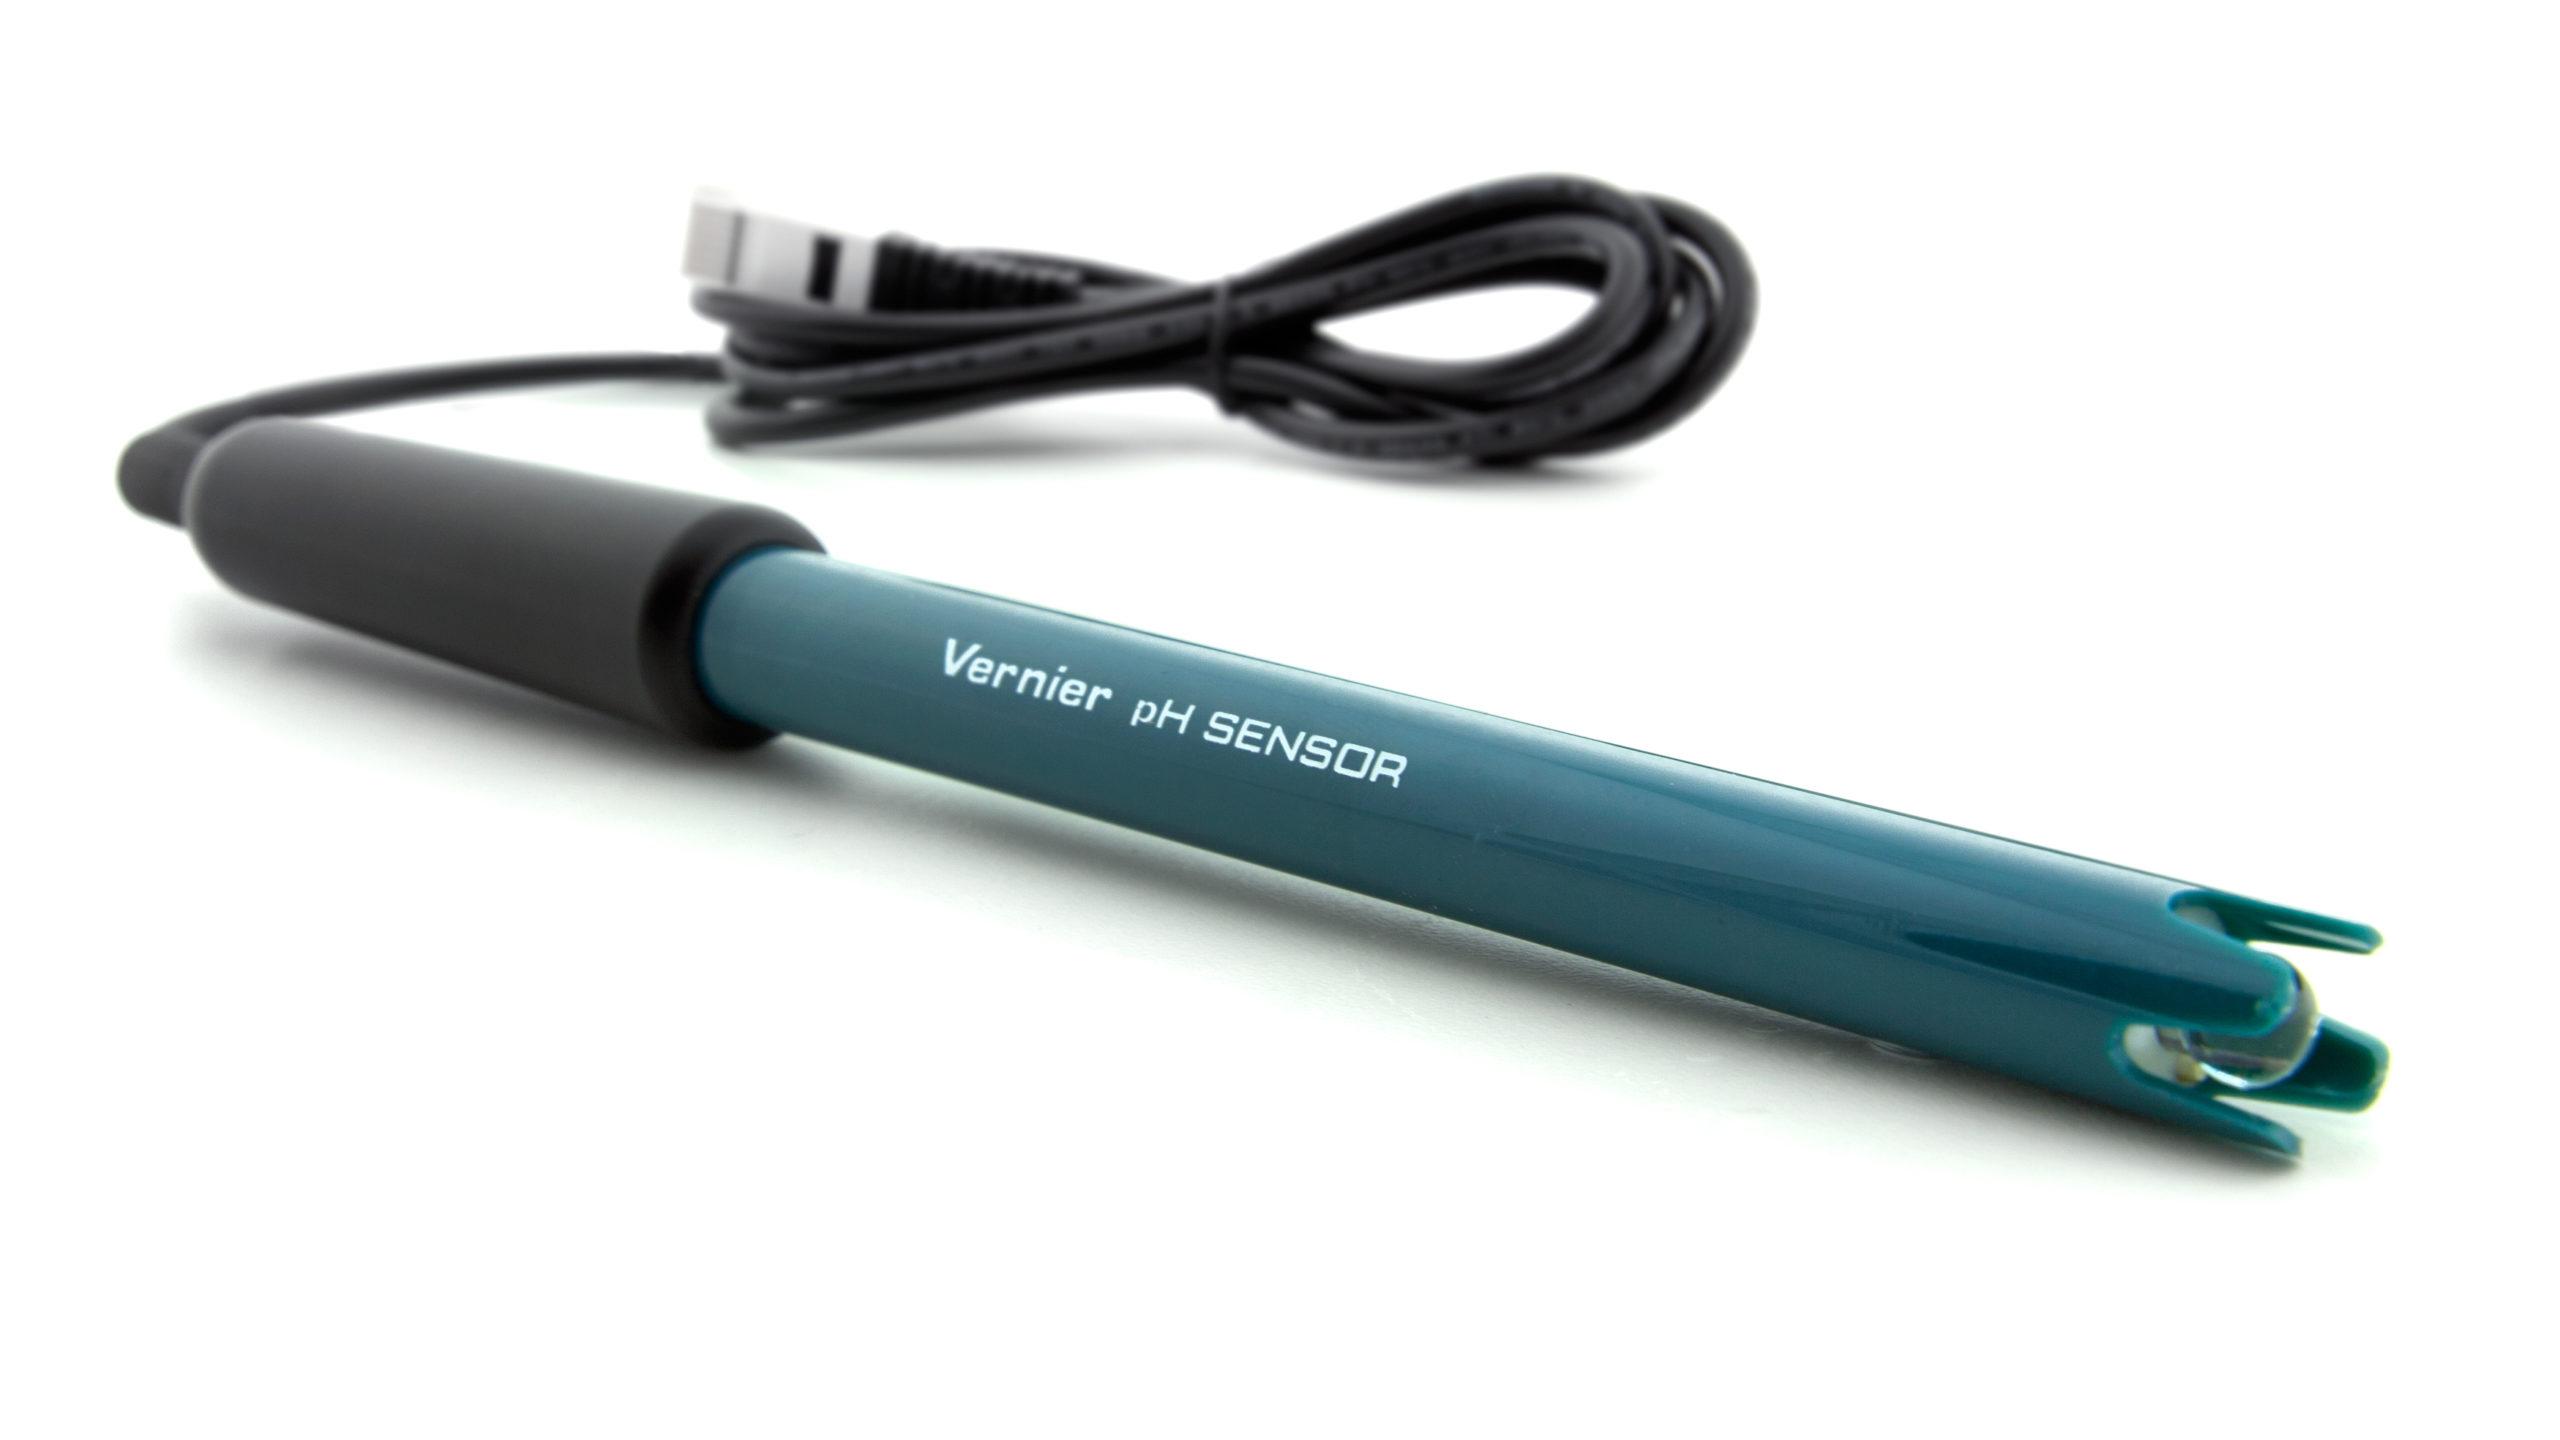
- Use a pH Sensor to monitor changes in pH as sodium hydroxide solution is added to a hydrochloric acid solution.
- Plot a graph of pH vs. volume of sodium hydroxide solution added.
- Use the graph to determine the equivalence point of the titration.
- Use the results to calculate the concentration of the hydrochloric acid solution.
Sensors and Equipment
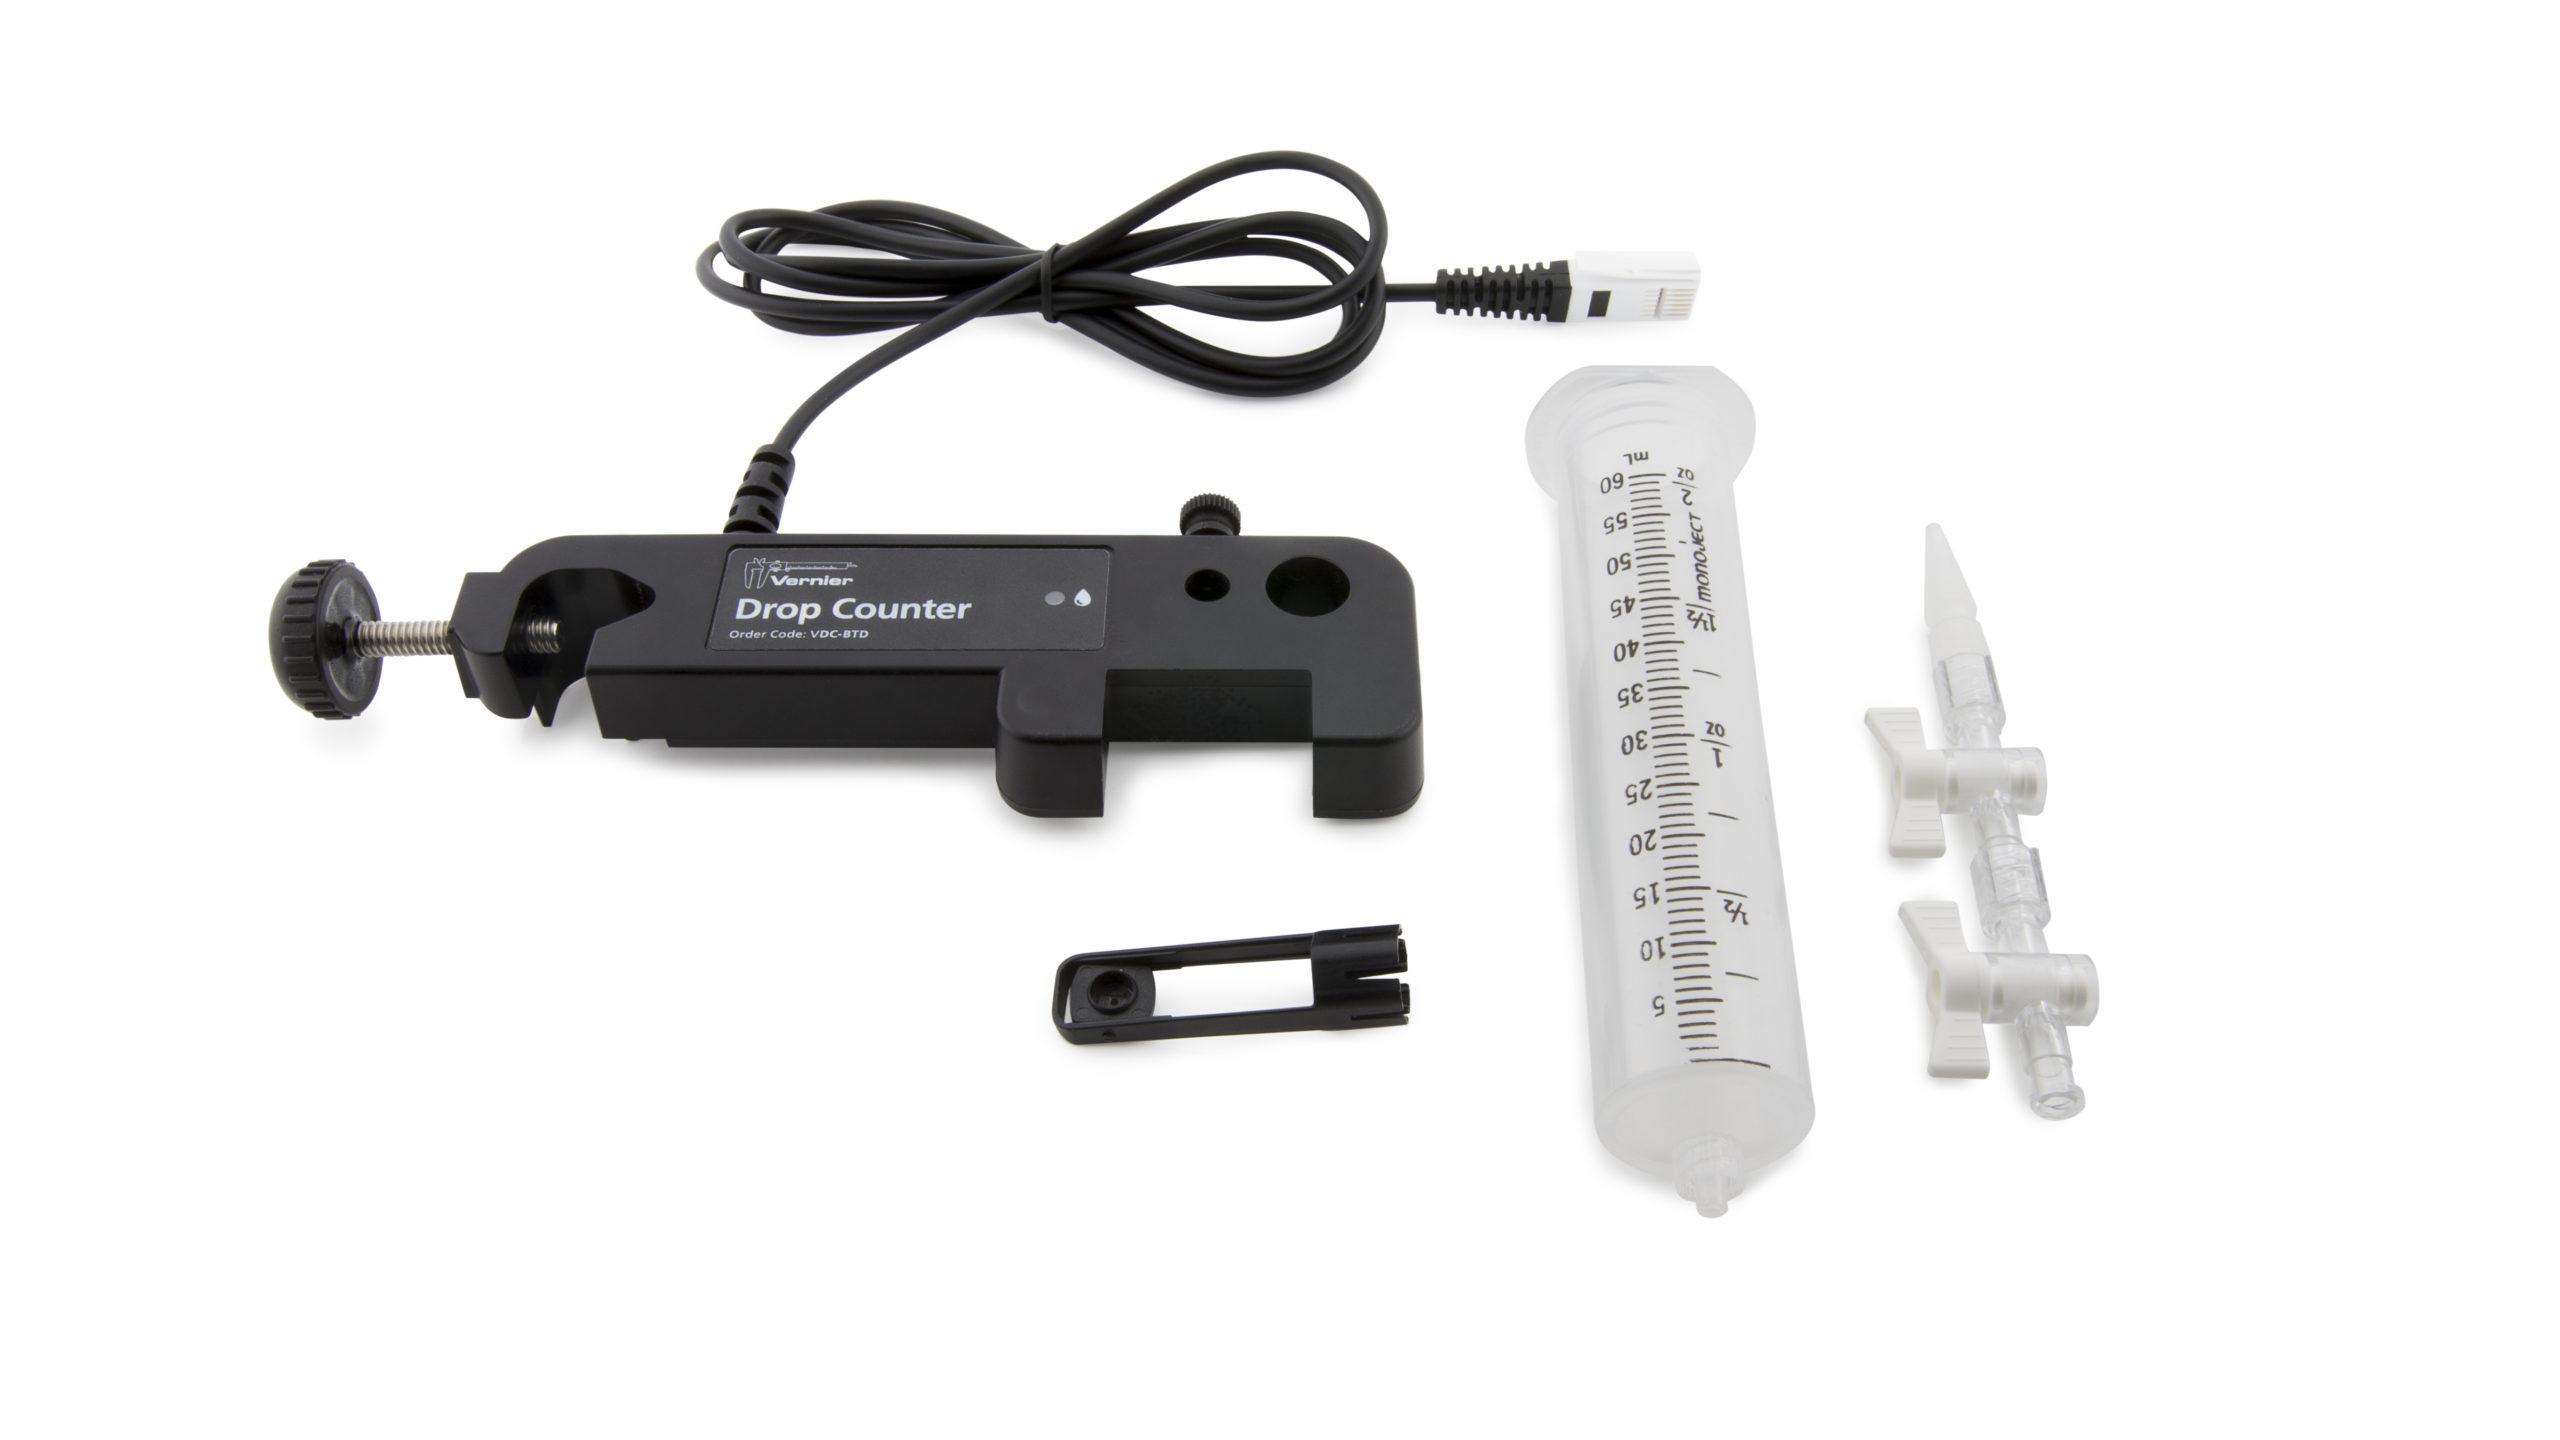
This experiment features the following sensors and equipment. Additional equipment may be required.
Ready to Experiment?
Ask an Expert
Get answers to your questions about how to teach this experiment with our support team.
- Call toll-free: 888-837-6437
- Chat with Us
- Email support@vernier.com
Purchase the Lab Book
This experiment is #24 of Chemistry with Vernier. The experiment in the book includes student instructions as well as instructor information for set up, helpful hints, and sample graphs and data.


