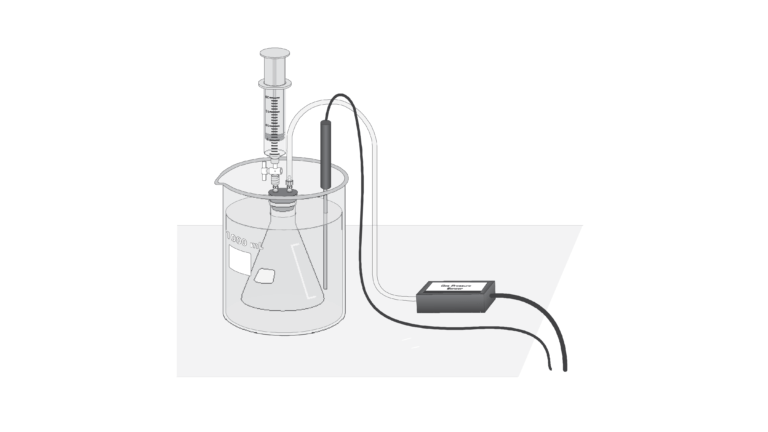
Introduction
When a liquid is placed in a container, and the container is sealed tightly, a portion of the liquid will evaporate. The newly formed gas molecules exert pressure in the container, while some of the gas condenses back into the liquid state. If the temperature inside the container is held constant, then at some point equilibrium will be reached. At equilibrium, the rate of condensation is equal to the rate of evaporation. The pressure at equilibrium is called vapor pressure, and will remain constant as long as the temperature in the container does not change.
In mathematical terms, the relationship between the vapor pressure of a liquid and temperature is described in the Clausius-Clayperon equation,
where ln P is the natural logarithm of the vapor pressure, ΔHvap is the heat of vaporization, R is the universal gas constant (8.31 J/mol•K), T is the absolute, or Kelvin, temperature, and C is a constant not related to heat capacity. Thus, the Clausius-Clayperon equation not only describes how vapor pressure is affected by temperature, but it relates these factors to the heat of vaporization of a liquid. ΔHvap is the amount of energy required to cause the evaporation of one mole of liquid at constant pressure.
Objectives
In this experiment, you will
- Measure the pressure inside a sealed vessel containing a volatile liquid over a range of temperatures.
- Determine the relationship between pressure and temperature of the volatile liquid.
- Calculate the heat of vaporization of the liquid.
Sensors and Equipment
This experiment features the following sensors and equipment. Additional equipment may be required.
Ready to Experiment?
Ask an Expert
Get answers to your questions about how to teach this experiment with our support team.
- Call toll-free: 888-837-6437
- Chat with Us
- Email support@vernier.com
Purchase the Lab Book
This experiment is #34 of Advanced Chemistry with Vernier. The experiment in the book includes student instructions as well as instructor information for set up, helpful hints, and sample graphs and data.


