Here are some of the common actions used with Graphical Analysis. Use the download link to access a screencast of the action.
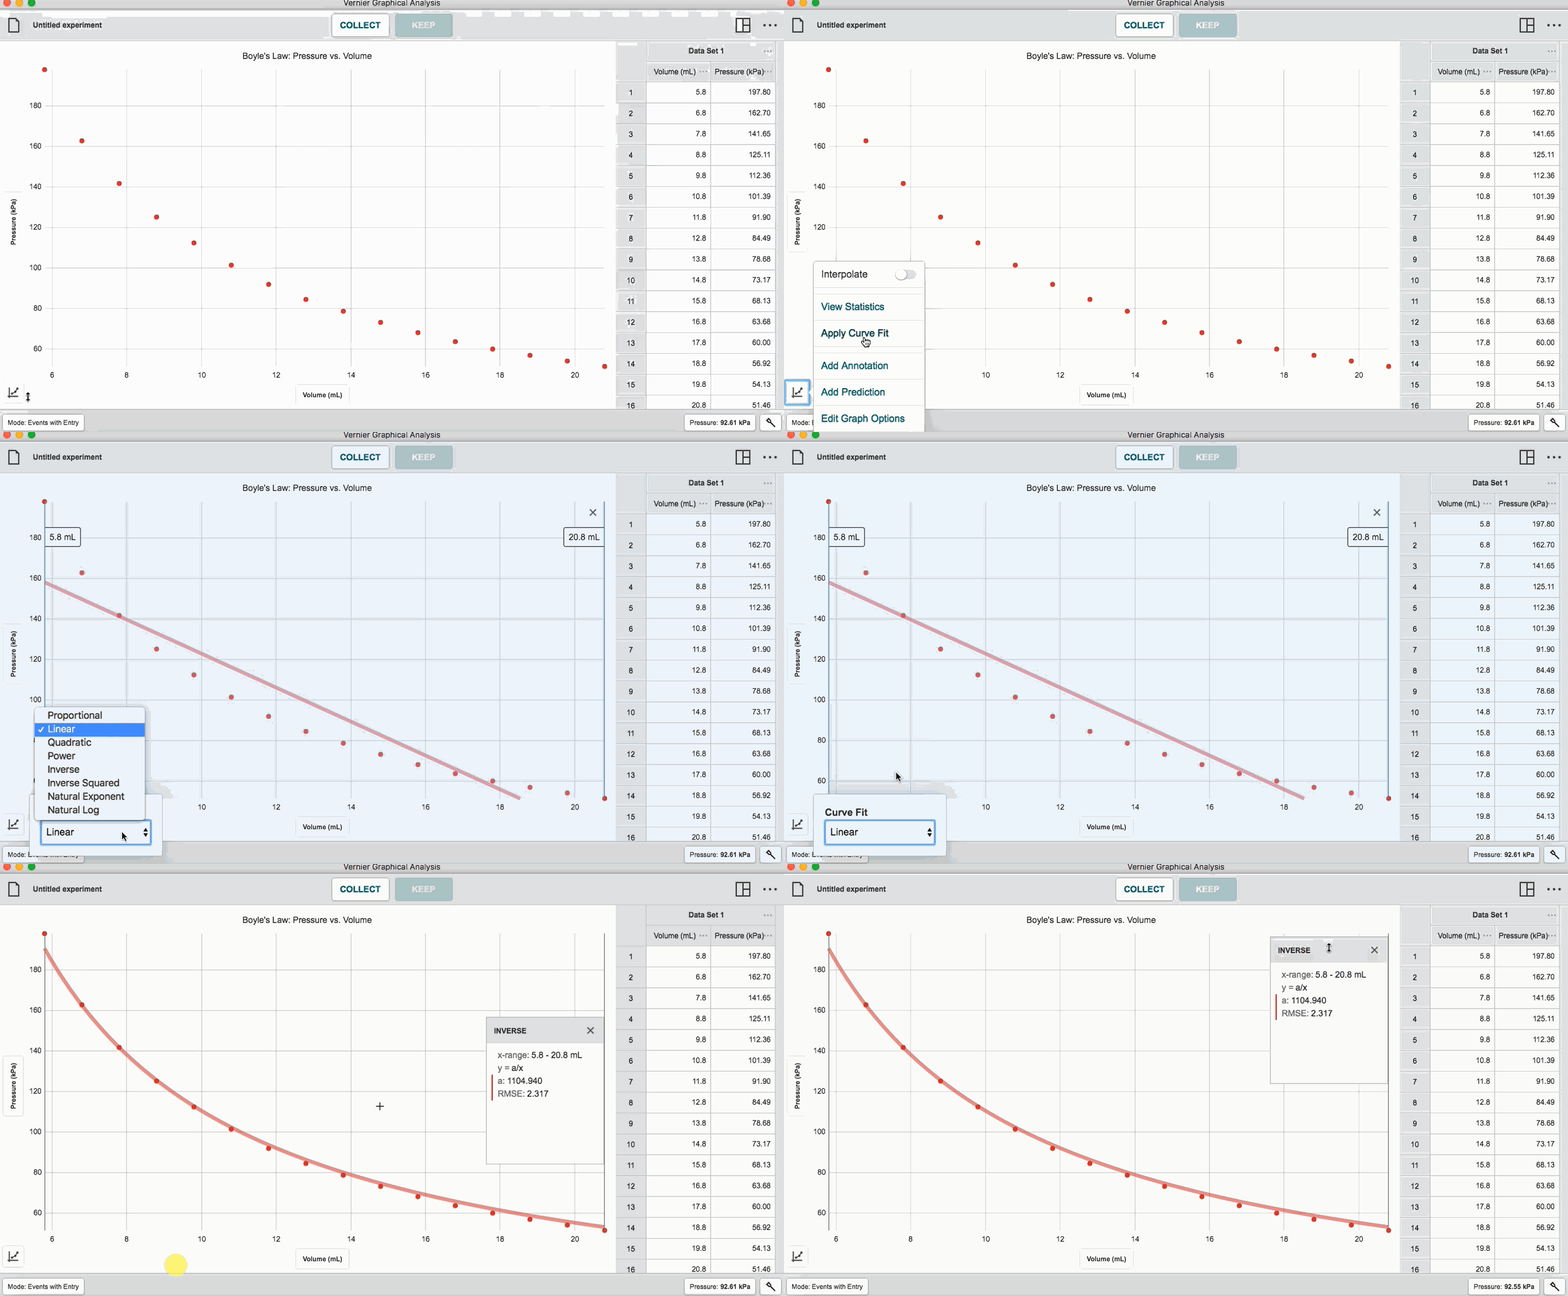
Apply a Curve Fit to All Data
Analyze data in the region defined by the graph’s x-axis range
- Click or tap the Graph Tools button
- Select a curve fit model
- Click or tap Apply to view the equation
Note: Data having x-coordinates within the x-range will be included in the analysis even if they are not visible on the graph.

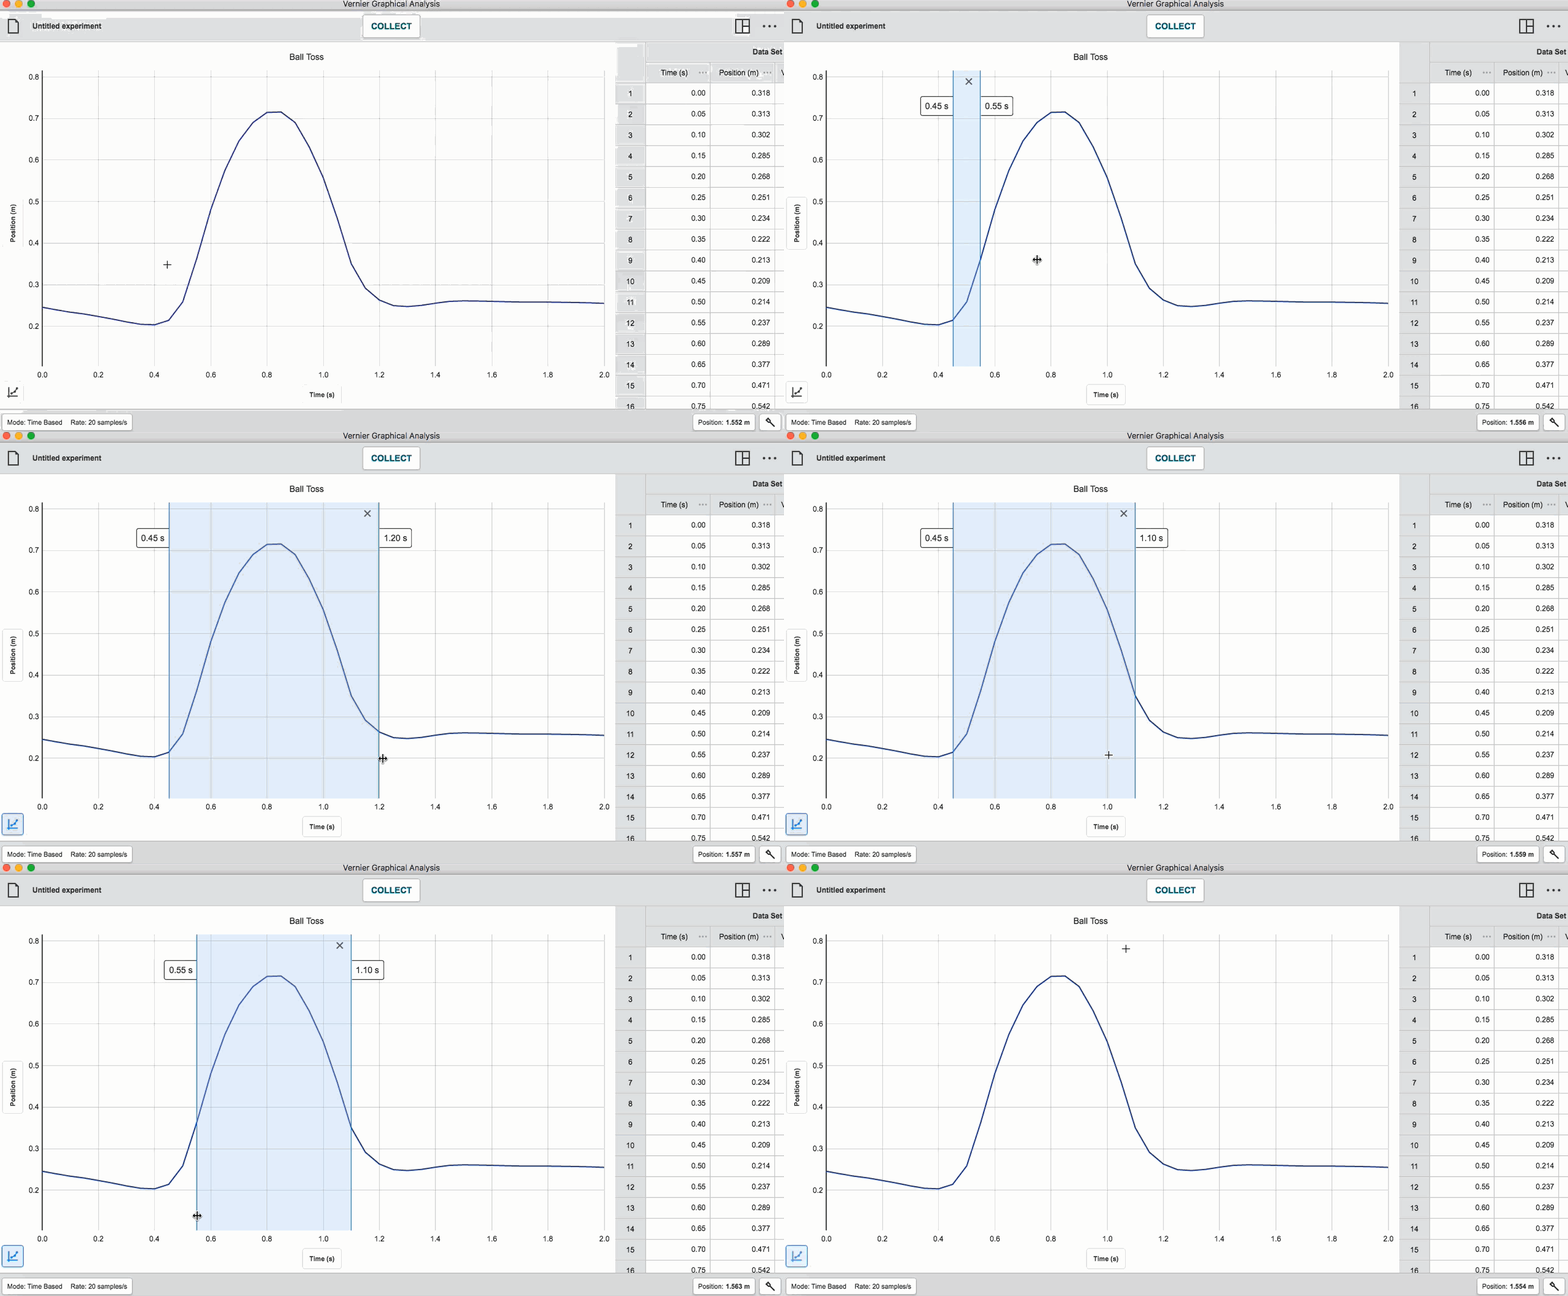
Select a Region
Select a region for data analysis
- Click or tap and drag across the graph to select a region
- If needed, drag the boundary lines to resize the region

Apply a Curve Fit to a Selected Region
Analyze a selection of your data
- Select a region
- Click or tap the Graph Tools button
- Select a curve fit model
- Click or tap Apply to view the equation
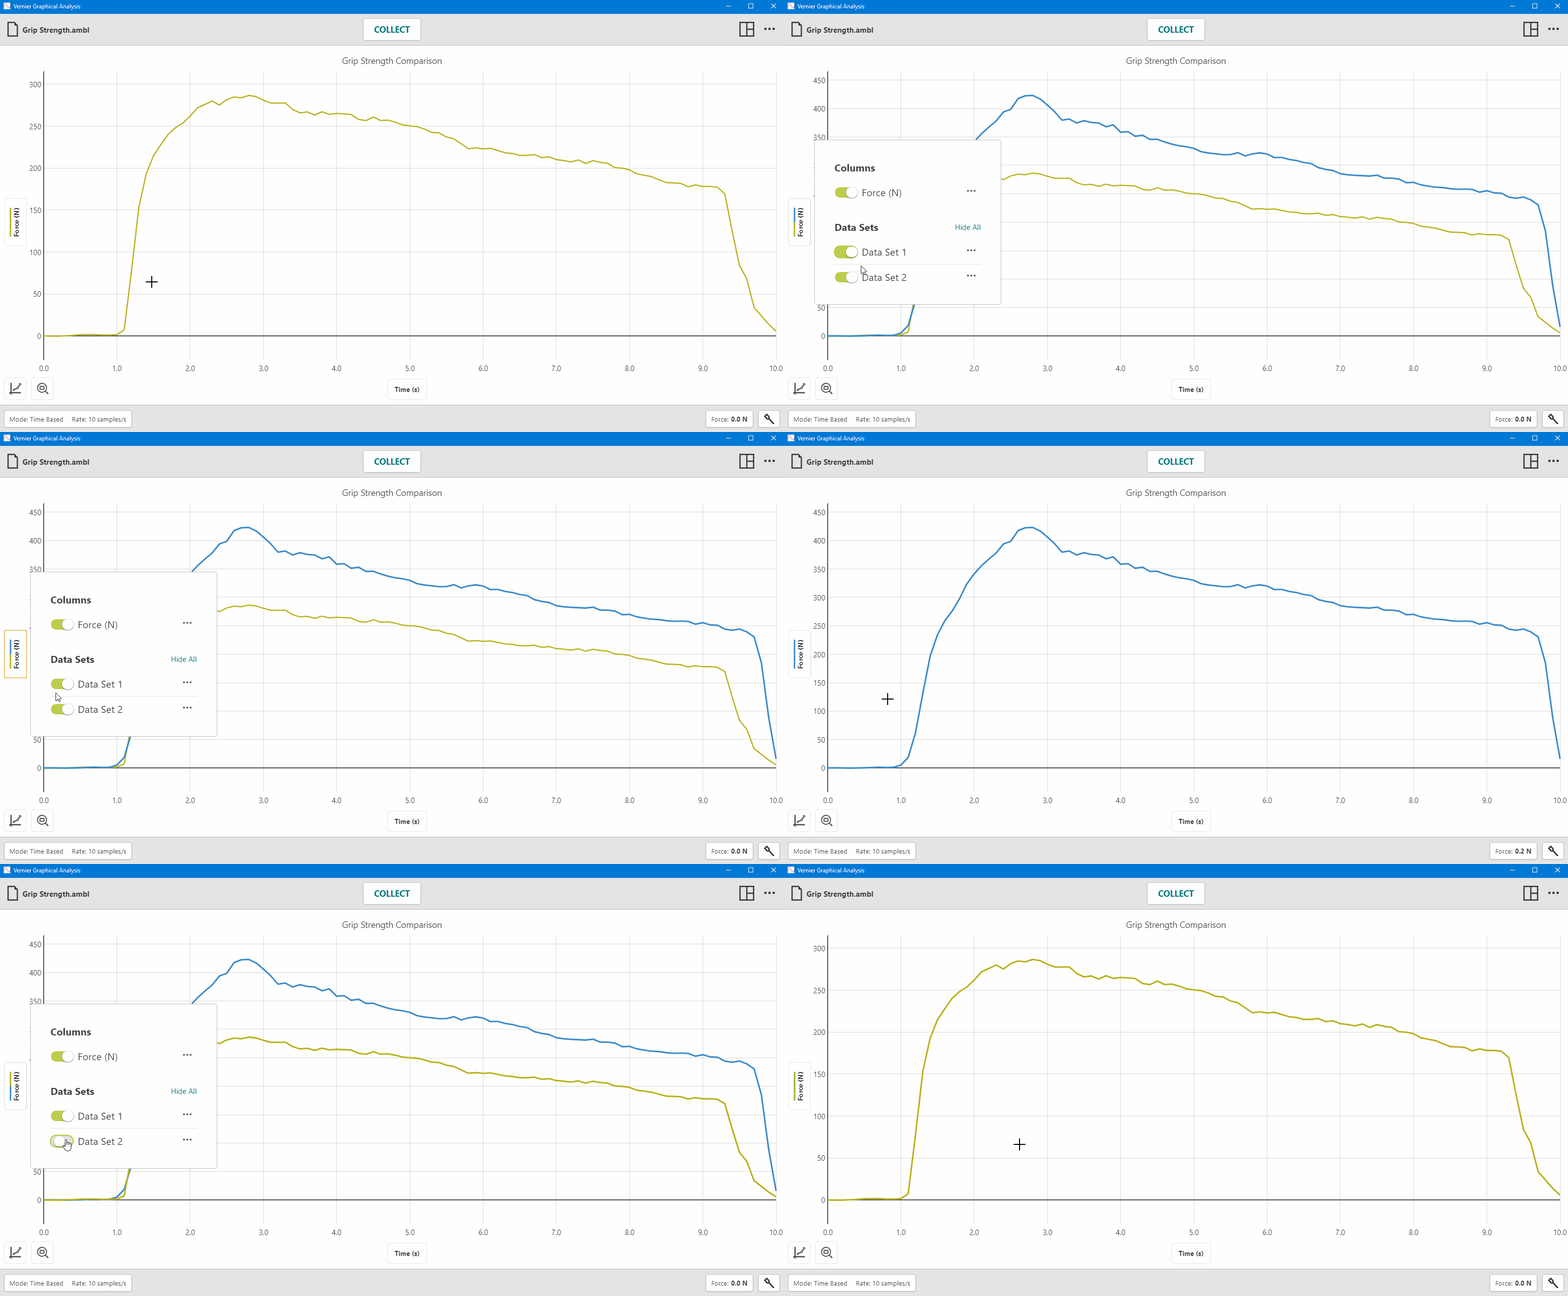
Plot Data from Multiple Data Sets
Add or remove the columns of data plotted on any graph
- Click or tap the y-axis label to display the selection popover
- Click or tap a data set to add or remove it from the graph
- Click or tap off of the popover to dismiss the tool

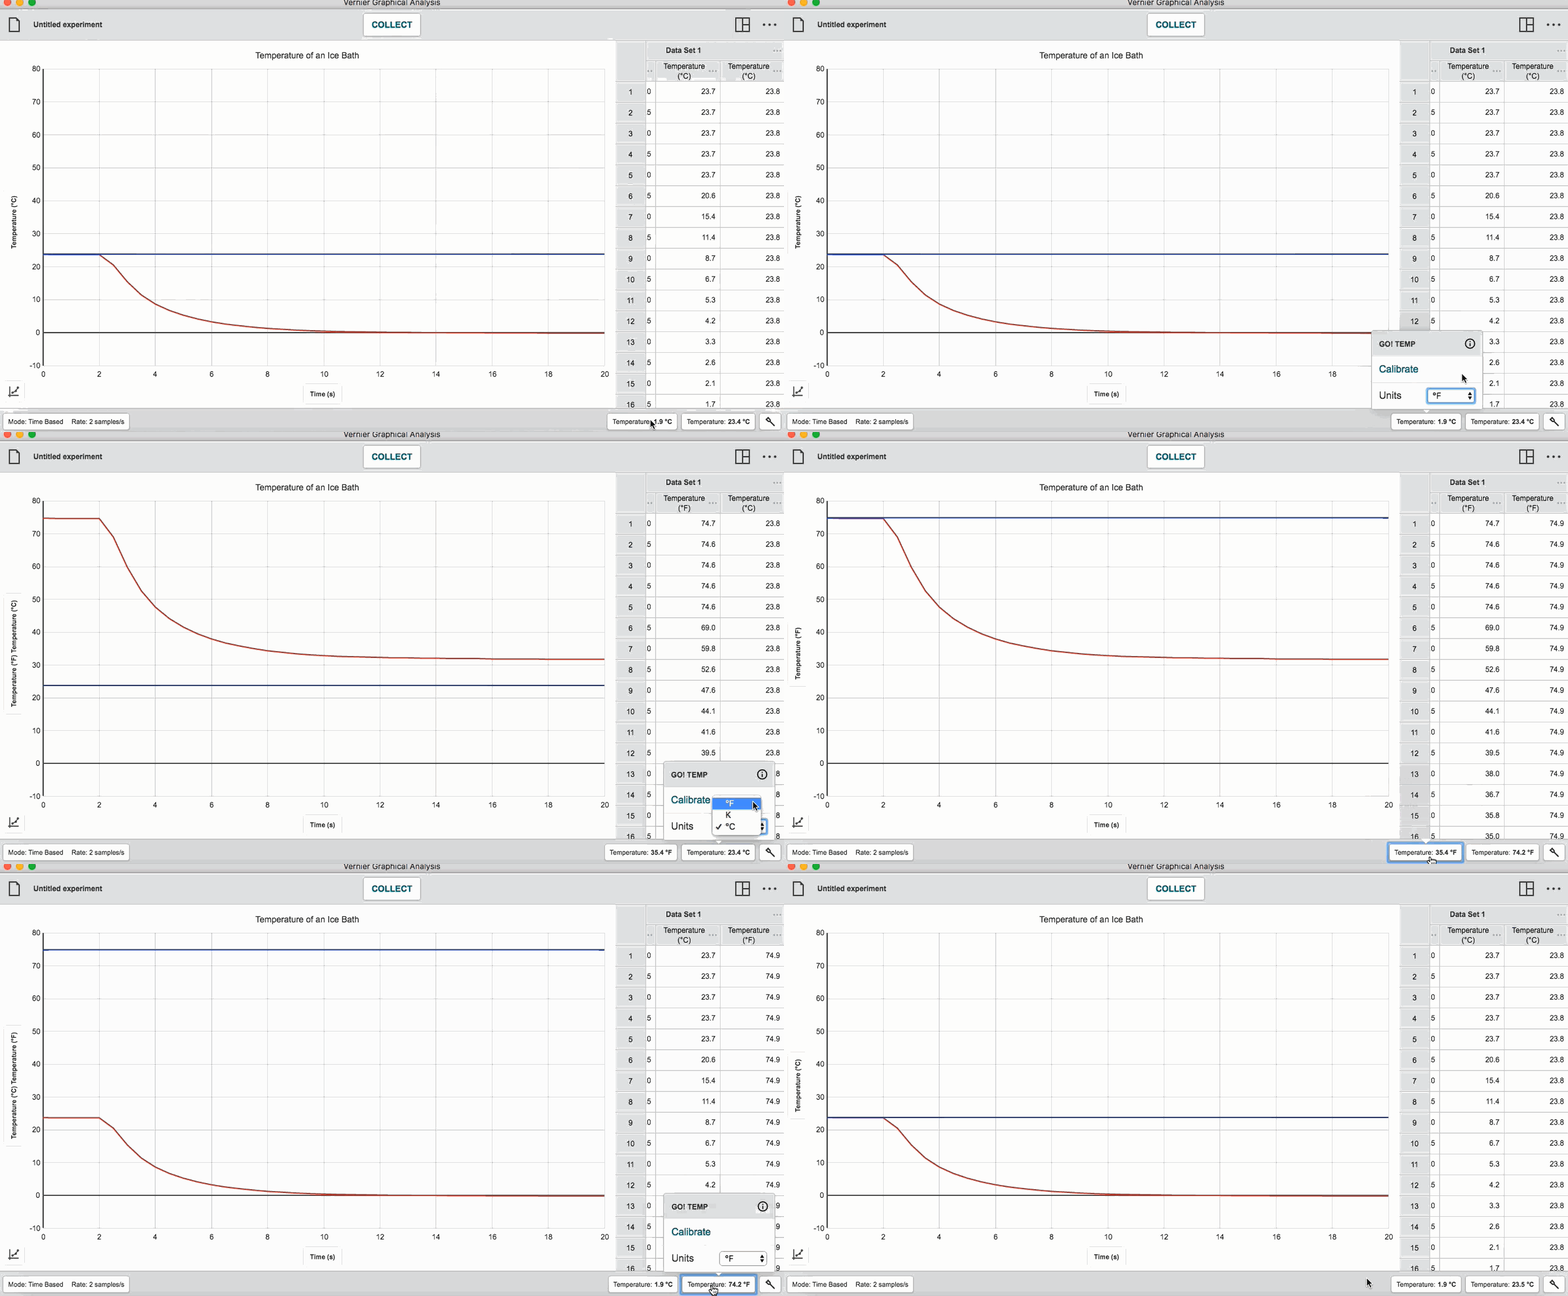
Change Sensor Units
Change sensor units for sensors that support multiple units
- Click or tap the sensor meter to view sensor options
- Select the desired units from the Units drop down
- Click or tap off the popover to dismiss the tool
Note: Changing units affects all data associated with a sensor including data already collected. The data table is updated accordingly.

