Walk the Line – Straight Line Distance Graphs
Experiment #1 from Real-World Math with Vernier
- Education Level
- High School
Introduction
When one quantity changes at a constant rate with respect to another, we say they are linearly related. Mathematically, we describe this relationship by defining a linear equation. In real-world applications, some quantities are linearly related and can be represented by using a straight-line graph.
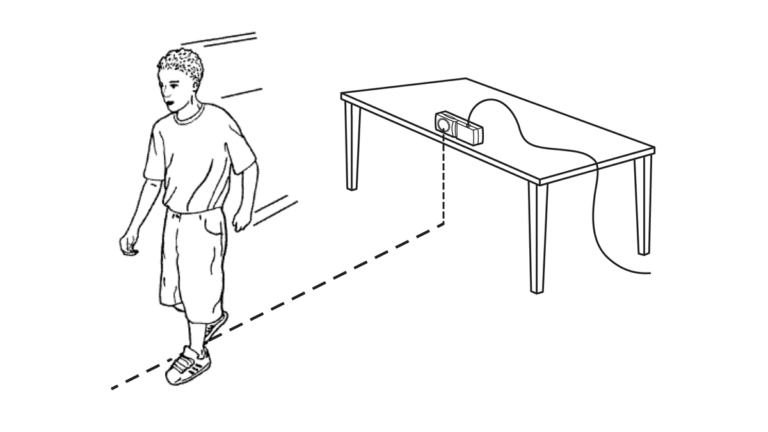
In this activity, you will create straight-line, or constant-speed, position versus time plots using a Motion Detector, and then develop linear equations to describe these plots mathematically.
Objectives
- Record distance versus time data for a person walking at a uniform rate.
- Analyze the data to extract slope and intercept information.
- Interpret the slope and intercept information for physical meaning.
Sensors and Equipment
This experiment features the following sensors and equipment. Additional equipment may be required.
Option 1

Option 2

Ready to Experiment?
Ask an Expert
Get answers to your questions about how to teach this experiment with our support team.
- Call toll-free: 888-837-6437
- Chat with Us
- Email support@vernier.com
Purchase the Lab Book
This experiment is #1 of Real-World Math with Vernier. The experiment in the book includes student instructions as well as instructor information for set up, helpful hints, and sample graphs and data.