Introduction
Blood pressure is determined by the output of the heart and the resistance to flow in the vascular system. These, in turn, are affected by factors such as the levels of certain hormones (renin, angiotensin II, aldosterone, cortisol, epinephrine, and norepinephrine), physical activity, emotional or physical stress, salt intake, and smoking. Blood pressure usually reaches a high at 6 a.m. and a low between 2 and 4 a.m. Small peaks and valleys occur every one to two hours throughout the day. For this reason, health care providers measure blood pressure at random times on multiple occasions before diagnosing hypertension, or elevated blood pressure.
Objectives
In this experiment, you will
- Obtain graphical representation of blood pressure measured at different times of the day.
- Analyze the variability of blood pressure readings individually and as a class.
- Correlate your findings with variables that may have influenced your blood pressure.
Sensors and Equipment
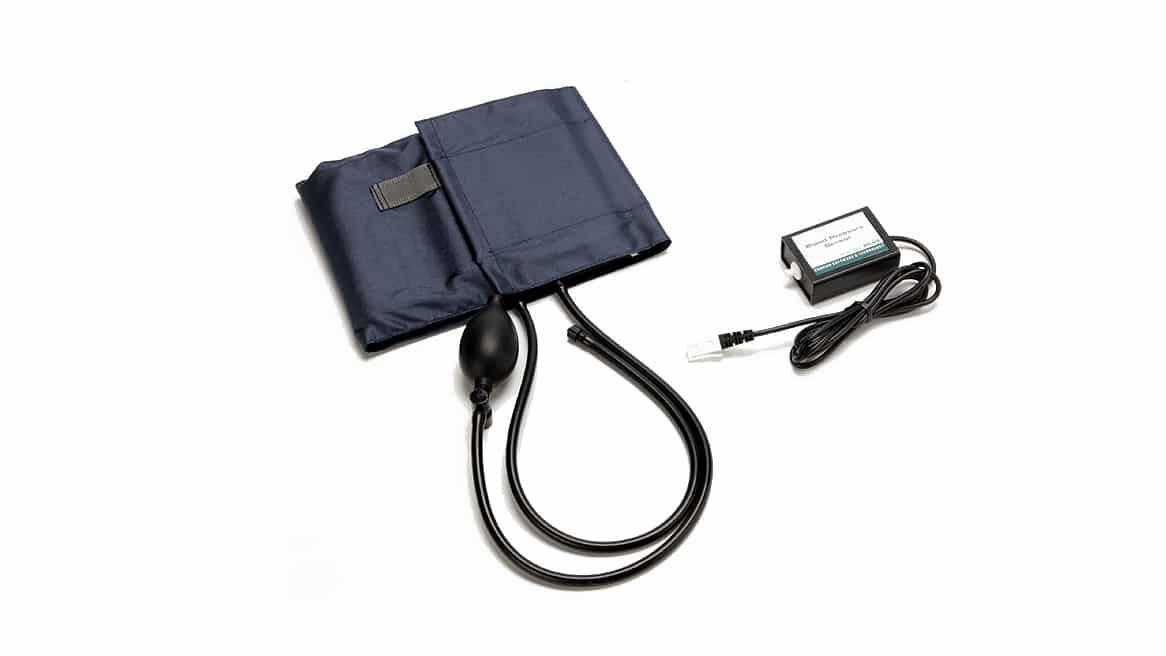
This experiment features the following sensors and equipment. Additional equipment may be required.
Ready to Experiment?
Ask an Expert
Get answers to your questions about how to teach this experiment with our support team.
- Call toll-free: 888-837-6437
- Chat with Us
- Email support@vernier.com
Purchase the Lab Book
This experiment is #9 of Human Physiology with Vernier. The experiment in the book includes student instructions as well as instructor information for set up, helpful hints, and sample graphs and data.


