Introduction
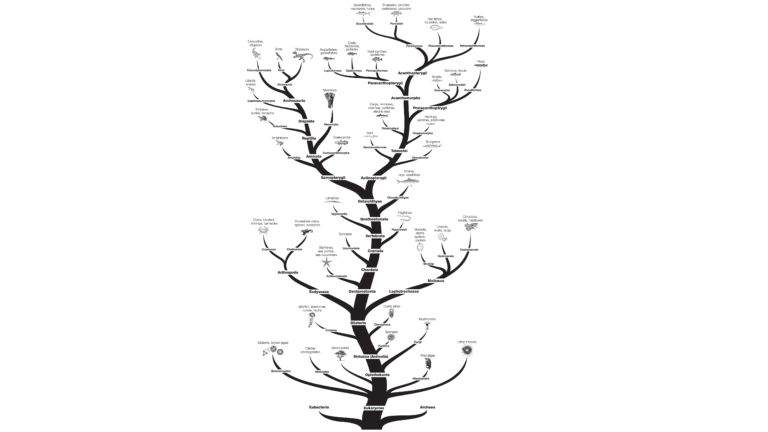
An evolutionary tree shows the evolutionary lineages of different species over relative time. Evolutionary trees, (also called cladograms), can be based on many different types of data. The traditional way of constructing evolutionary trees was to look at the physical morphology of organisms, including sizes, shapes and developmental structures of both living organisms and fossils. Today, similarities and differences in molecular data (protein and DNA sequences) are also being used. Both methods are valuable and often complement each other.
You will use the evolutionary tree to make predictions about the relatedness of the species you will examine in this investigation. Following the analysis and interpretation of your electrophoresis results, you will create a cladogram from your own results and compare your cladogram with your predictions.
For this investigation, it is useful to compare both closely related and distantly related fish. In addition to using the tree below to make your predictions, we recommend that you research additional information on the evolutionary histories of fishes, using the Internet, and biology and zoology books.
The data used to construct the evolutionary tree was obtained from the cladograms on the tree of life web page from the University of Arizona (www.tolweb.org). (Please note that the field of phylogenetics is ever changing and different methods used to construct a phylogenetic tree often result in differences between trees, hence the data on the tree of life web page may not concur exactly with “textbook” evolutionary trees.)
Objectives
In this Preliminary Activity, you will (1) extract proteins from muscle tissue, (2) conduct electrophoresis of the resulting protein extracts, (3) analyze the results using Logger Pro, and (4) construct a cladogram using the results.
After completing the Preliminary Activity, you will first use reference sources to find out more about protein gel electrophoresis before you choose and investigate a researchable question. Some topics to consider in your reference search are:
- protein
- amino acid
- gel electrophoresis
- fish
- evolutionary tree
- cladogram
- phylogenetic relationships
- SDS-PAGE
- denature
- molecular weight
- dalton
- kilodalton (kD)
Correlations
Teaching to an educational standard? This experiment supports the standards below.
- International Baccalaureate (IB) 2025/Biology
- A3.2.3—Advantages of classification corresponding to evolutionary relationships
- A3.2.4—Clades as groups of organisms with common ancestry and shared characteristics
- A3.2.5—Gradual accumulation of sequence differences as the basis for estimates of when clades diverged from a common ancestor
- A3.2.6—Base sequences of genes or amino acid sequences of proteins as the basis for constructing cladograms
- A3.2.7—Analysing cladograms
- A3.2.8—Using cladistics to investigate whether the classification of groups corresponds to evolutionary relationships
- A4.1.2—Evidence for evolution from base sequences in DNA or RNA and amino acid sequences in proteins
Ready to Experiment?
Ask an Expert
Get answers to your questions about how to teach this experiment with our support team.
- Call toll-free: 888-837-6437
- Chat with Us
- Email support@vernier.com
Purchase the Lab Book
This experiment is #21 of Investigating Biology through Inquiry. The experiment in the book includes student instructions as well as instructor information for set up, helpful hints, and sample graphs and data.

